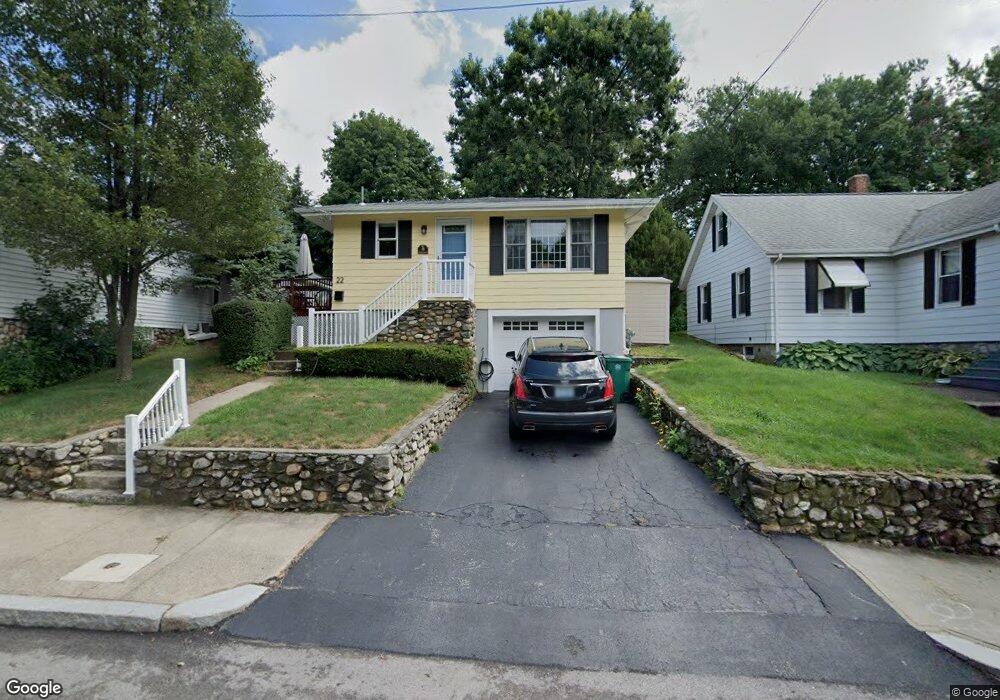
22 Rodman St Woonsocket, RI 02895
East Woonsocket NeighborhoodEstimated Value: $346,563 - $414,000
3
Beds
1
Bath
900
Sq Ft
$419/Sq Ft
Est. Value
About This Home
This home is located at 22 Rodman St, Woonsocket, RI 02895 and is currently estimated at $376,891, approximately $418 per square foot. 22 Rodman St is a home located in Providence County with nearby schools including Woonsocket High School and Mount Saint Charles Academy.
Ownership History
Date
Name
Owned For
Owner Type
Purchase Details
Closed on
Aug 17, 2021
Sold by
Allard Donald R and Allard Nicole V
Bought by
Allard Ft and Allard
Current Estimated Value
Purchase Details
Closed on
Aug 25, 1989
Sold by
Martineau Bertrand
Bought by
Dubois Marc A
Create a Home Valuation Report for This Property
The Home Valuation Report is an in-depth analysis detailing your home's value as well as a comparison with similar homes in the area
Home Values in the Area
Average Home Value in this Area
Purchase History
| Date | Buyer | Sale Price | Title Company |
|---|---|---|---|
| Allard Ft | -- | None Available | |
| Allard Ft | -- | None Available | |
| Allard Ft | -- | None Available | |
| Dubois Marc A | $106,500 | -- |
Source: Public Records
Mortgage History
| Date | Status | Borrower | Loan Amount |
|---|---|---|---|
| Previous Owner | Dubois Marc A | $94,000 | |
| Previous Owner | Dubois Marc A | $50,000 | |
| Previous Owner | Dubois Marc A | $100,000 | |
| Previous Owner | Dubois Marc A | $90,000 |
Source: Public Records
Tax History
| Year | Tax Paid | Tax Assessment Tax Assessment Total Assessment is a certain percentage of the fair market value that is determined by local assessors to be the total taxable value of land and additions on the property. | Land | Improvement |
|---|---|---|---|---|
| 2025 | $3,741 | $333,100 | $103,900 | $229,200 |
| 2024 | $3,414 | $234,800 | $92,200 | $142,600 |
| 2023 | $3,283 | $234,800 | $92,200 | $142,600 |
| 2022 | $3,283 | $234,800 | $92,200 | $142,600 |
| 2021 | $3,306 | $139,200 | $55,900 | $83,300 |
| 2020 | $3,341 | $139,200 | $55,900 | $83,300 |
| 2018 | $3,352 | $139,200 | $55,900 | $83,300 |
| 2017 | $3,480 | $115,600 | $45,300 | $70,300 |
| 2016 | $3,681 | $115,600 | $45,300 | $70,300 |
| 2015 | $4,229 | $115,600 | $45,300 | $70,300 |
| 2014 | $4,144 | $115,300 | $49,900 | $65,400 |
Source: Public Records
Map
Nearby Homes
- 68 Kenwood St
- 366 Aylsworth Ave
- 375 Congress St
- 727 Mendon Rd
- 60 Ruskin Ave
- 372 Cumberland Hill Rd
- 568 Elm St
- 7 Theresa Marie Ave
- 56 Mailloux St
- 255 Knollwood Dr
- 1088 Diamond Hill Rd
- 213 St Louis Ave
- 212 Saint Louis Ave
- 311 Elm St
- 79 Saint Agnes Ave
- 89 Saint Agnes Ave
- 188 Saint Louis Ave
- 178 Saint Louis Ave
- 263 Elm St
- 202 Paine St
Your Personal Tour Guide
Ask me questions while you tour the home.