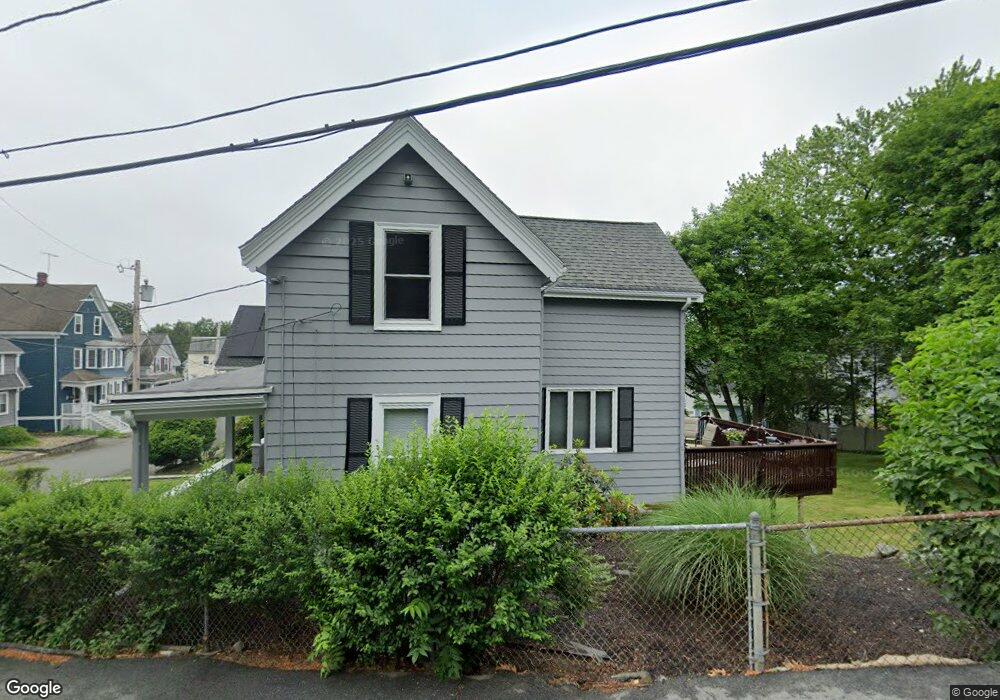
22 Roy St Swampscott, MA 01907
Estimated Value: $609,000 - $652,000
3
Beds
1
Bath
1,099
Sq Ft
$576/Sq Ft
Est. Value
About This Home
This home is located at 22 Roy St, Swampscott, MA 01907 and is currently estimated at $633,513, approximately $576 per square foot. 22 Roy St is a home located in Essex County with nearby schools including Swampscott Middle School and Swampscott High School.
Ownership History
Date
Name
Owned For
Owner Type
Purchase Details
Closed on
Apr 21, 1998
Sold by
Snow Sheryl E and Lee Robert E
Bought by
Huss John and Huss Joann L
Current Estimated Value
Purchase Details
Closed on
Aug 13, 1996
Sold by
Belliveau Peter and Belliveau Dennis
Bought by
Snow Sheryl E and Lee Robert E
Create a Home Valuation Report for This Property
The Home Valuation Report is an in-depth analysis detailing your home's value as well as a comparison with similar homes in the area
Home Values in the Area
Average Home Value in this Area
Purchase History
| Date | Buyer | Sale Price | Title Company |
|---|---|---|---|
| Huss John | $155,000 | -- | |
| Huss John | $155,000 | -- | |
| Snow Sheryl E | $119,000 | -- | |
| Snow Sheryl E | $119,000 | -- |
Source: Public Records
Mortgage History
| Date | Status | Borrower | Loan Amount |
|---|---|---|---|
| Open | Snow Sheryl E | $202,500 | |
| Closed | Snow Sheryl E | $173,000 | |
| Closed | Snow Sheryl E | $175,000 |
Source: Public Records
Tax History Compared to Growth
Tax History
| Year | Tax Paid | Tax Assessment Tax Assessment Total Assessment is a certain percentage of the fair market value that is determined by local assessors to be the total taxable value of land and additions on the property. | Land | Improvement |
|---|---|---|---|---|
| 2025 | $7,002 | $610,500 | $289,100 | $321,400 |
| 2024 | $6,819 | $593,500 | $275,300 | $318,200 |
| 2023 | $6,435 | $548,100 | $254,900 | $293,200 |
| 2022 | $6,078 | $473,700 | $224,300 | $249,400 |
| 2021 | $5,760 | $417,400 | $173,300 | $244,100 |
| 2020 | $5,773 | $403,700 | $163,100 | $240,600 |
| 2019 | $5,826 | $383,300 | $142,700 | $240,600 |
| 2018 | $5,853 | $365,800 | $142,700 | $223,100 |
| 2017 | $5,722 | $327,900 | $122,400 | $205,500 |
| 2016 | $5,241 | $302,400 | $96,900 | $205,500 |
| 2015 | $5,186 | $302,400 | $96,900 | $205,500 |
| 2014 | $4,634 | $247,800 | $69,300 | $178,500 |
Source: Public Records
Map
Nearby Homes
- 44 Cherry St Unit 2
- 100 Burpee Rd
- 59 Essex St Unit 59B
- 29-31 Essex Ave Unit 2
- 25 E Park Ave
- 35 Columbia Ave
- 80 Norfolk Ave Unit 1
- 44 Valley Rd
- 31 Madison St
- 106 Norfolk Ave
- 9 Sampson Ave
- 189 Burrill St Unit 2
- 30 Clifton Ave
- 133 Eastern Ave Unit 8
- 6 Washburn St
- 76 Stetson Ave
- 26 Groveland St
- 175 Essex St
- 129 Williams Ave
- 249 Chatham St