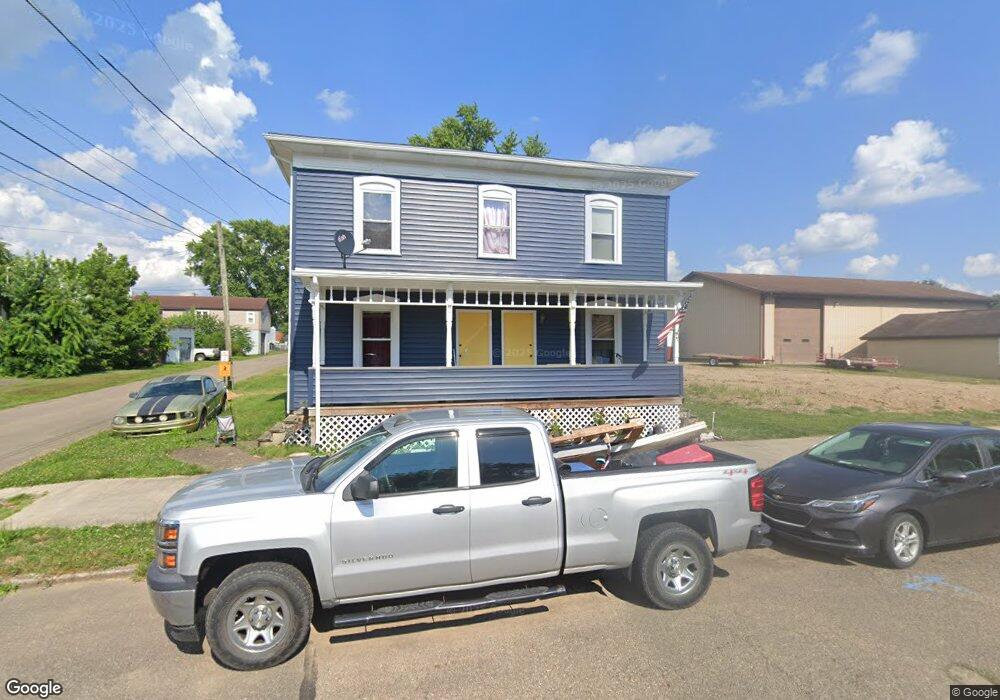
22 S 2nd St Dennison, OH 44621
Estimated Value: $116,732 - $645,000
5
Beds
2
Baths
1,792
Sq Ft
$144/Sq Ft
Est. Value
About This Home
This home is located at 22 S 2nd St, Dennison, OH 44621 and is currently estimated at $257,683, approximately $143 per square foot. 22 S 2nd St is a home located in Tuscarawas County with nearby schools including Claymont High School and Immaculate Conception School.
Ownership History
Date
Name
Owned For
Owner Type
Purchase Details
Closed on
Jul 24, 2023
Sold by
Booth James D and Booth Carol S
Bought by
Enes Holly Dawn and Rapp Dorothy
Current Estimated Value
Home Financials for this Owner
Home Financials are based on the most recent Mortgage that was taken out on this home.
Original Mortgage
$74,800
Outstanding Balance
$67,715
Interest Rate
6.07%
Mortgage Type
New Conventional
Estimated Equity
$189,968
Purchase Details
Closed on
Oct 5, 1994
Sold by
Deramo Gary V
Bought by
Booth James D and Booth Carol
Create a Home Valuation Report for This Property
The Home Valuation Report is an in-depth analysis detailing your home's value as well as a comparison with similar homes in the area
Home Values in the Area
Average Home Value in this Area
Purchase History
| Date | Buyer | Sale Price | Title Company |
|---|---|---|---|
| Enes Holly Dawn | $93,500 | None Listed On Document | |
| Enes Holly Dawn | $93,500 | None Listed On Document | |
| Booth James D | $3,000 | -- |
Source: Public Records
Mortgage History
| Date | Status | Borrower | Loan Amount |
|---|---|---|---|
| Open | Enes Holly Dawn | $74,800 | |
| Closed | Enes Holly Dawn | $74,800 |
Source: Public Records
Tax History Compared to Growth
Tax History
| Year | Tax Paid | Tax Assessment Tax Assessment Total Assessment is a certain percentage of the fair market value that is determined by local assessors to be the total taxable value of land and additions on the property. | Land | Improvement |
|---|---|---|---|---|
| 2024 | $1,055 | $28,960 | $3,620 | $25,340 |
| 2023 | $1,055 | $82,750 | $10,340 | $72,410 |
| 2022 | $1,084 | $28,963 | $3,619 | $25,344 |
| 2021 | $1,025 | $25,540 | $2,338 | $23,202 |
| 2020 | $1,047 | $25,540 | $2,338 | $23,202 |
| 2019 | $1,004 | $25,540 | $2,338 | $23,202 |
| 2018 | $913 | $21,550 | $1,970 | $19,580 |
| 2017 | $938 | $21,550 | $1,970 | $19,580 |
| 2016 | $933 | $21,550 | $1,970 | $19,580 |
| 2014 | $947 | $21,690 | $1,970 | $19,720 |
| 2013 | $953 | $21,690 | $1,970 | $19,720 |
Source: Public Records
Map
Nearby Homes
- 128 S 6th St
- 11 Sherman St
- 309 Welch St
- 214 N Dawson St
- 519 N Uhrich St
- 140 S Main St
- 113 E 4th St
- 122 E 6th St
- 816 N 1st St
- 618 Parrish St
- 911 N Water St
- 515 W 3rd St
- 426 Mccrea Ave
- 621 Newport Ave
- 1107 Parrish St
- 537 Wilcoxen St
- 315 S Wallace St
- 1508 Roanoke Ave
- 7261 Waterworks Hill Rd SE
- 4752 Gatchell Rd SE