Estimated Value: $93,000 - $180,000
4
Beds
1
Bath
1,269
Sq Ft
$99/Sq Ft
Est. Value
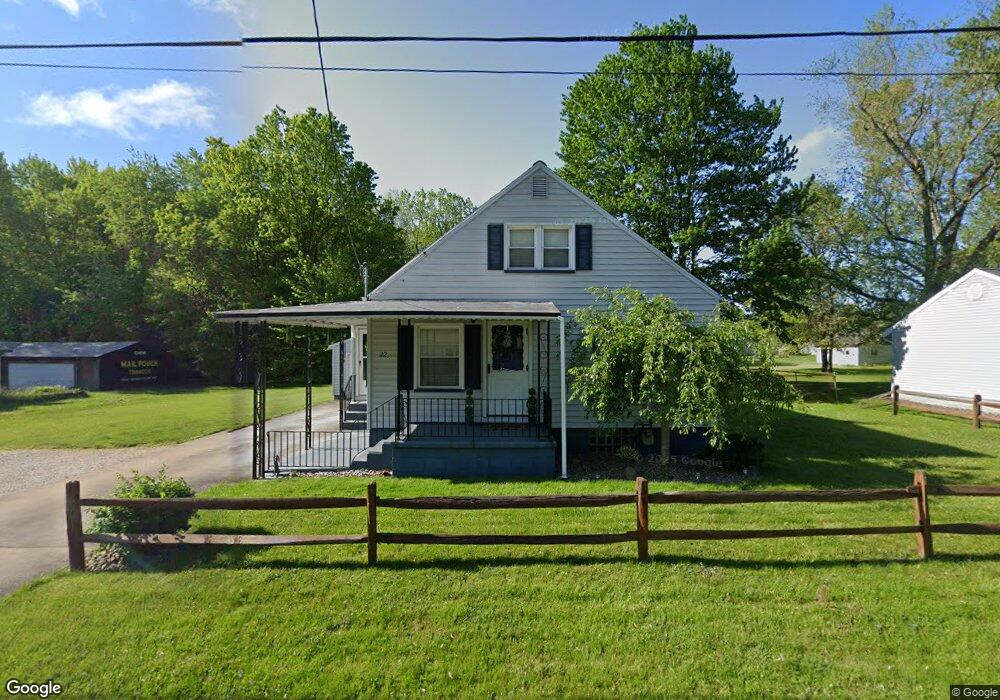
About This Home
This home is located at 22 Saint John Ave, Niles, OH 44446 and is currently estimated at $126,009, approximately $99 per square foot. 22 Saint John Ave is a home located in Trumbull County with nearby schools including Niles Primary School, Niles Intermediate School, and Niles Middle School.
Ownership History
Date
Name
Owned For
Owner Type
Purchase Details
Closed on
Aug 31, 2016
Sold by
Bowman Ronald
Bought by
Drotar Bridgett
Current Estimated Value
Home Financials for this Owner
Home Financials are based on the most recent Mortgage that was taken out on this home.
Original Mortgage
$54,003
Interest Rate
3.87%
Mortgage Type
FHA
Purchase Details
Closed on
Aug 23, 2016
Sold by
King Deborah F
Bought by
Bowman Ronald and Bowman Delena S
Home Financials for this Owner
Home Financials are based on the most recent Mortgage that was taken out on this home.
Original Mortgage
$54,003
Interest Rate
3.87%
Mortgage Type
FHA
Purchase Details
Closed on
Apr 22, 2016
Sold by
Shelar Ryan and Shelar Elizabeth
Bought by
Bowman Ronald
Purchase Details
Closed on
Aug 22, 2002
Sold by
Devengencie Dustin J and Devengencie Janine A
Bought by
Shelar Ryan
Purchase Details
Closed on
Jan 1, 1990
Sold by
Grant Sandra L
Bought by
Grant and Grant Sandra L
Create a Home Valuation Report for This Property
The Home Valuation Report is an in-depth analysis detailing your home's value as well as a comparison with similar homes in the area
Home Values in the Area
Average Home Value in this Area
Purchase History
| Date | Buyer | Sale Price | Title Company |
|---|---|---|---|
| Drotar Bridgett | $55,000 | American Land Title Agency I | |
| Bowman Ronald | -- | None Available | |
| Bowman Ronald | $10,500 | None Available | |
| Shelar Ryan | $76,500 | -- | |
| Grant | -- | -- |
Source: Public Records
Mortgage History
| Date | Status | Borrower | Loan Amount |
|---|---|---|---|
| Previous Owner | Drotar Bridgett | $54,003 |
Source: Public Records
Tax History
| Year | Tax Paid | Tax Assessment Tax Assessment Total Assessment is a certain percentage of the fair market value that is determined by local assessors to be the total taxable value of land and additions on the property. | Land | Improvement |
|---|---|---|---|---|
| 2024 | $1,150 | $26,570 | $3,290 | $23,280 |
| 2023 | $1,139 | $26,570 | $3,290 | $23,280 |
| 2022 | $987 | $19,670 | $3,290 | $16,380 |
| 2021 | $1,037 | $19,670 | $3,290 | $16,380 |
| 2020 | $1,046 | $19,670 | $3,290 | $16,380 |
| 2019 | $1,099 | $19,670 | $3,290 | $16,380 |
| 2018 | $1,096 | $19,670 | $3,290 | $16,380 |
| 2017 | $1,090 | $19,670 | $3,290 | $16,380 |
| 2016 | $961 | $17,650 | $1,650 | $16,000 |
| 2015 | $1,465 | $17,650 | $1,650 | $16,000 |
| 2014 | $1,468 | $17,650 | $1,650 | $16,000 |
| 2013 | $1,367 | $18,660 | $1,650 | $17,010 |
Source: Public Records
Map
Nearby Homes
- 145 North Rd
- 245 North Rd
- 270 North Rd
- 27 Wilson Ave
- 0 Harrison St
- 1309 Ashland Ave
- 1225 Beech St
- 512 John St
- 0 Federal
- 1187 Deforest Rd SE
- 401 Sheridan Ave
- 14 Evans St
- 63 Linden Ave
- 1503 Gypsy Ln
- 46 & 48 Hyde Ave
- 3109 Woodbine Ave SE
- 22 N Arlington Ave
- 124 N Cedar Ave
- 4 N Butler Ave
- 520 Washington Ave
- 16 Saint John Ave
- 30 Saint John Ave
- 34 Saint John Ave
- 23 Saint John Ave
- 21 Saint John Ave
- 175 North Rd
- 153 North Rd
- 38 Saint John Ave
- 203 North Rd
- 35 Saint John Ave
- 42 Saint John Ave
- 39 Saint John Ave
- 221 North Rd
- 46 Saint John Ave
- 306 North Rd
- 41 Saint John Ave
- 50 Saint John Ave
- 231 North Rd
- 108 Blossom Ln
- 119 North Rd
Your Personal Tour Guide
Ask me questions while you tour the home.