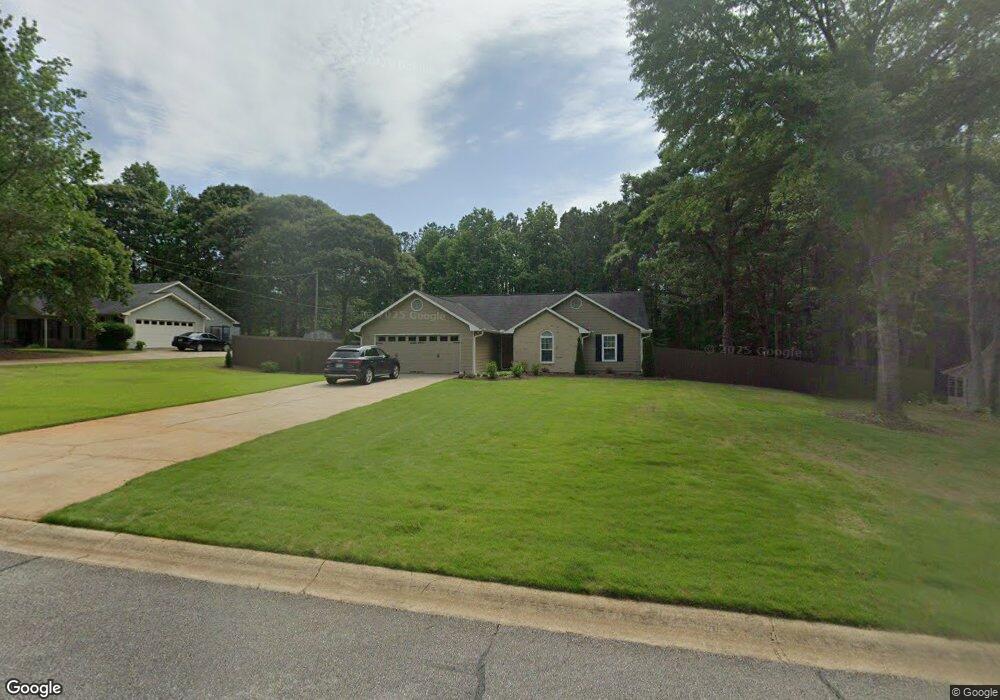
22 Sandstone Ln Sharpsburg, GA 30277
Estimated Value: $280,630 - $322,000
3
Beds
2
Baths
1,419
Sq Ft
$218/Sq Ft
Est. Value
About This Home
This home is located at 22 Sandstone Ln, Sharpsburg, GA 30277 and is currently estimated at $308,908, approximately $217 per square foot. 22 Sandstone Ln is a home located in Coweta County with nearby schools including Poplar Road Elementary School, Lee Middle School, and East Coweta High School.
Ownership History
Date
Name
Owned For
Owner Type
Purchase Details
Closed on
May 21, 2021
Sold by
Wright James E
Bought by
Lawrence William H and Lawrence Lyla S
Current Estimated Value
Home Financials for this Owner
Home Financials are based on the most recent Mortgage that was taken out on this home.
Original Mortgage
$187,378
Outstanding Balance
$168,907
Interest Rate
2.9%
Mortgage Type
New Conventional
Estimated Equity
$140,001
Purchase Details
Closed on
Apr 22, 1996
Sold by
Hud
Bought by
Wright James Tammy
Purchase Details
Closed on
Oct 3, 1995
Sold by
Norwest Mort
Bought by
Hud
Purchase Details
Closed on
Aug 5, 1993
Bought by
Mason John Edward
Purchase Details
Closed on
Nov 25, 1992
Bought by
Jerry Ballard Homes
Create a Home Valuation Report for This Property
The Home Valuation Report is an in-depth analysis detailing your home's value as well as a comparison with similar homes in the area
Home Values in the Area
Average Home Value in this Area
Purchase History
| Date | Buyer | Sale Price | Title Company |
|---|---|---|---|
| Lawrence William H | $234,222 | -- | |
| Wright James Tammy | -- | -- | |
| Hud | -- | -- | |
| Norwest Mort | $84,100 | -- | |
| Mason John Edward | $75,000 | -- | |
| Jerry Ballard Homes | $93,000 | -- |
Source: Public Records
Mortgage History
| Date | Status | Borrower | Loan Amount |
|---|---|---|---|
| Open | Lawrence William H | $187,378 | |
| Closed | Wright James Tammy | $0 |
Source: Public Records
Tax History Compared to Growth
Tax History
| Year | Tax Paid | Tax Assessment Tax Assessment Total Assessment is a certain percentage of the fair market value that is determined by local assessors to be the total taxable value of land and additions on the property. | Land | Improvement |
|---|---|---|---|---|
| 2025 | $1,345 | $101,233 | $24,000 | $77,233 |
| 2024 | $1,179 | $93,866 | $24,000 | $69,866 |
| 2023 | $1,179 | $87,610 | $18,000 | $69,610 |
| 2022 | $1,003 | $83,069 | $18,000 | $65,069 |
| 2021 | $1,590 | $65,058 | $16,000 | $49,058 |
| 2020 | $1,599 | $65,058 | $16,000 | $49,058 |
| 2019 | $1,399 | $52,593 | $10,000 | $42,593 |
| 2018 | $1,402 | $52,593 | $10,000 | $42,593 |
| 2017 | $1,402 | $52,593 | $10,000 | $42,593 |
| 2016 | $1,387 | $52,593 | $10,000 | $42,593 |
| 2015 | $1,366 | $52,593 | $10,000 | $42,593 |
| 2014 | $916 | $40,371 | $8,000 | $32,371 |
Source: Public Records
Map
Nearby Homes
- 140 Halo Trace
- 0 Highway 154 Unit 10470800
- 180 Saint James Place
- 25 Chemin Place
- 25 Lentry Dr
- 250 Bob Smith Rd
- 196 Bob Smith Rd
- 0 Bob Smith Rd Unit 10562838
- 20 Beaver Creek Ln
- 138 Main St
- 68 Winchester Dr
- 270 Sturgess Run
- 1 Mcintosh Trail
- 1367 Sharpsburg McCollum Rd
- 8 Chiefs Trail
- 21 Lake Park Ct
- 316 Winchester Dr
- 46 Lullwater Ct
- 131 Pecan Lake Dr
- 296 Mcintosh Trail
- 16 Sandstone Ln
- 32 Sandstone Ln
- 46 Sandstone Ln
- 21 Sandstone Ln
- 31 Sandstone Ln
- 9 Sandstone Ln
- 41 Sandstone Ln
- 87 Sandstone Dr
- 60 Sandstone Dr
- 58 Sandstone Ln
- 50 Sandstone Dr
- 53 Sandstone Ln
- 74 Sandstone Dr
- 84 Sandstone Dr
- 40 Sandstone Dr
- 15 Sandstone Dr
- 0 Sandstone Ln Unit 30 8363698
- 28 Sandstone Dr
- 62 Sandstone Ln
- 135 Sandstone Dr