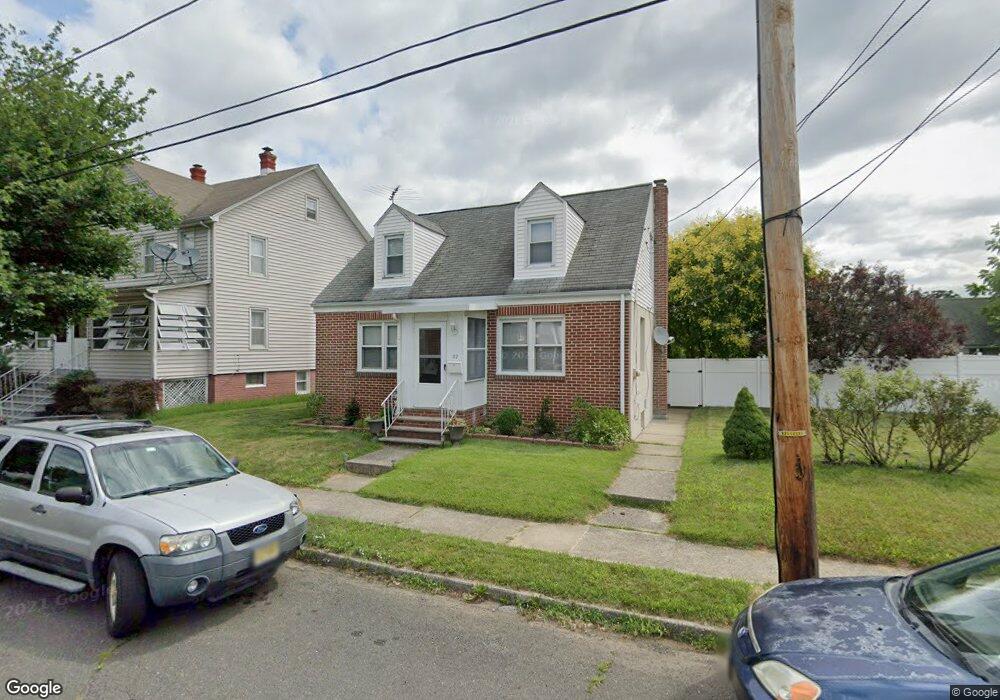
22 Schack Ave South River, NJ 08882
Estimated Value: $476,200 - $533,000
3
Beds
2
Baths
1,289
Sq Ft
$385/Sq Ft
Est. Value
About This Home
This home is located at 22 Schack Ave, South River, NJ 08882 and is currently estimated at $496,800, approximately $385 per square foot. 22 Schack Ave is a home located in Middlesex County with nearby schools including South River Primary School, South River Elementary School, and South River Middle School.
Ownership History
Date
Name
Owned For
Owner Type
Purchase Details
Closed on
Aug 24, 2009
Sold by
Federal Home Loan Mortgage Corporation
Bought by
Silva Antonio
Current Estimated Value
Home Financials for this Owner
Home Financials are based on the most recent Mortgage that was taken out on this home.
Original Mortgage
$163,920
Interest Rate
5.01%
Mortgage Type
New Conventional
Purchase Details
Closed on
Feb 18, 2009
Sold by
Scott Robert W and Scott Barbara A
Bought by
Federal Home Loan Mortgage Corp
Purchase Details
Closed on
Sep 21, 2004
Sold by
Koch Barbara
Bought by
Scott Barbara and Scott Robert
Create a Home Valuation Report for This Property
The Home Valuation Report is an in-depth analysis detailing your home's value as well as a comparison with similar homes in the area
Home Values in the Area
Average Home Value in this Area
Purchase History
We collect this data history from publicly available records. To have your information removed, we recommend requesting removal directly through your county’s website.
| Date | Buyer | Sale Price | Title Company |
|---|---|---|---|
| Silva Antonio | $204,900 | Fidelity Natl Title Ins Co | |
| Federal Home Loan Mortgage Corp | -- | None Available | |
| Scott Barbara | $125,000 | -- |
Source: Public Records
Mortgage History
We collect this data history from publicly available records. To have your information removed, we recommend requesting removal directly through your county’s website.
| Date | Status | Borrower | Loan Amount |
|---|---|---|---|
| Previous Owner | Silva Antonio | $163,920 |
Source: Public Records
Tax History
| Year | Tax Paid | Tax Assessment Tax Assessment Total Assessment is a certain percentage of the fair market value that is determined by local assessors to be the total taxable value of land and additions on the property. | Land | Improvement |
|---|---|---|---|---|
| 2025 | $6,289 | $246,900 | $139,500 | $107,400 |
| 2024 | $6,101 | $246,900 | $139,500 | $107,400 |
| 2023 | $6,101 | $246,900 | $139,500 | $107,400 |
| 2022 | $5,995 | $246,900 | $139,500 | $107,400 |
| 2021 | $4,058 | $246,900 | $139,500 | $107,400 |
| 2020 | $5,647 | $246,900 | $139,500 | $107,400 |
| 2019 | $5,585 | $67,800 | $26,800 | $41,000 |
| 2018 | $5,450 | $67,800 | $26,800 | $41,000 |
| 2017 | $5,251 | $67,800 | $26,800 | $41,000 |
| 2016 | $5,052 | $67,800 | $26,800 | $41,000 |
| 2015 | $4,706 | $64,600 | $26,800 | $37,800 |
| 2014 | $4,598 | $64,600 | $26,800 | $37,800 |
Source: Public Records
Map
Nearby Homes
Your Personal Tour Guide
Ask me questions while you tour the home.