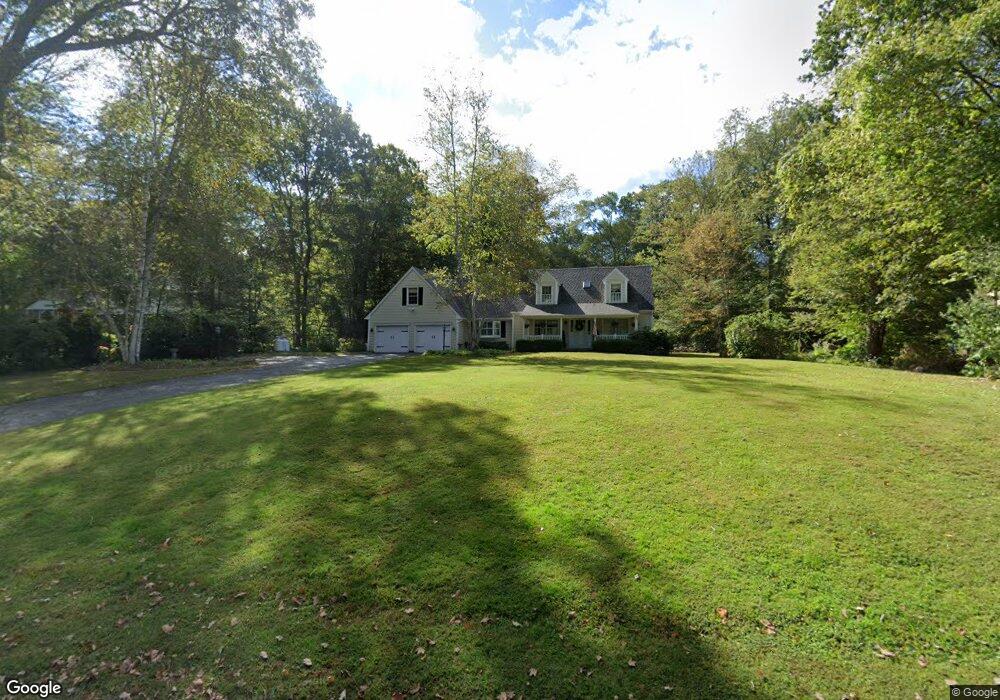
22 Seabury Ave Ledyard, CT 06339
Estimated Value: $496,000 - $562,000
3
Beds
3
Baths
1,966
Sq Ft
$265/Sq Ft
Est. Value
About This Home
This home is located at 22 Seabury Ave, Ledyard, CT 06339 and is currently estimated at $520,178, approximately $264 per square foot. 22 Seabury Ave is a home located in New London County with nearby schools including Ledyard Middle School and Ledyard High School.
Ownership History
Date
Name
Owned For
Owner Type
Purchase Details
Closed on
Sep 16, 2005
Sold by
Leberman Odin and Leberman Julianna
Bought by
Jansson Catherine
Current Estimated Value
Home Financials for this Owner
Home Financials are based on the most recent Mortgage that was taken out on this home.
Original Mortgage
$287,900
Interest Rate
5.84%
Purchase Details
Closed on
Sep 12, 2003
Sold by
Baughman Michael and Baughman Lynn
Bought by
Leberman Odin and Leberman Juliana
Home Financials for this Owner
Home Financials are based on the most recent Mortgage that was taken out on this home.
Original Mortgage
$252,000
Interest Rate
6.22%
Purchase Details
Closed on
Jul 20, 1998
Sold by
Adams John D and Adams Joan H
Bought by
Gaughman Michael D and Baughman Lynn Y
Purchase Details
Closed on
May 26, 1995
Sold by
Quinlan Raymond J
Bought by
Mellow John J and Mellow Sharon
Create a Home Valuation Report for This Property
The Home Valuation Report is an in-depth analysis detailing your home's value as well as a comparison with similar homes in the area
Home Values in the Area
Average Home Value in this Area
Purchase History
| Date | Buyer | Sale Price | Title Company |
|---|---|---|---|
| Jansson Catherine | $359,900 | -- | |
| Leberman Odin | $315,000 | -- | |
| Gaughman Michael D | $239,000 | -- | |
| Mellow John J | $230,000 | -- |
Source: Public Records
Mortgage History
| Date | Status | Borrower | Loan Amount |
|---|---|---|---|
| Open | Mellow John J | $250,000 | |
| Closed | Mellow John J | $287,900 | |
| Previous Owner | Mellow John J | $252,000 |
Source: Public Records
Tax History
| Year | Tax Paid | Tax Assessment Tax Assessment Total Assessment is a certain percentage of the fair market value that is determined by local assessors to be the total taxable value of land and additions on the property. | Land | Improvement |
|---|---|---|---|---|
| 2025 | $8,634 | $232,470 | $54,670 | $177,800 |
| 2024 | $8,131 | $230,930 | $54,670 | $176,260 |
| 2023 | $7,981 | $230,930 | $54,670 | $176,260 |
| 2022 | $7,810 | $230,930 | $54,670 | $176,260 |
| 2021 | $7,759 | $230,930 | $54,670 | $176,260 |
| 2020 | $7,745 | $221,480 | $65,100 | $156,380 |
| 2019 | $7,765 | $221,480 | $65,100 | $156,380 |
| 2018 | $7,595 | $221,480 | $65,100 | $156,380 |
| 2017 | $7,207 | $221,480 | $65,100 | $156,380 |
| 2016 | $7,065 | $221,480 | $65,100 | $156,380 |
| 2015 | $6,733 | $221,480 | $65,100 | $156,380 |
| 2014 | $6,932 | $231,840 | $65,100 | $166,740 |
Source: Public Records
Map
Nearby Homes
- 25 Coachman Pike
- 3 Hilltop Dr
- 24 Fairway Dr Unit 9
- 669 Colonel Ledyard Hwy
- 16 Abbey Rd
- 14 Abbey Rd
- 991 Shewville Rd
- 20 Lakeside Dr Unit K
- 14 Pennywise Ln
- 16 Marlene Dr
- 115 Meeting House Ln
- 23 Avery Hill Rd
- 48 Bittersweet Dr
- 381 Route 2
- 497 Colonel Ledyard Hwy
- 256 Route 2
- 11 Willow Ln
- 22 Boulder Way
- 104 Route 2a
- 575 Shewville Rd
Your Personal Tour Guide
Ask me questions while you tour the home.