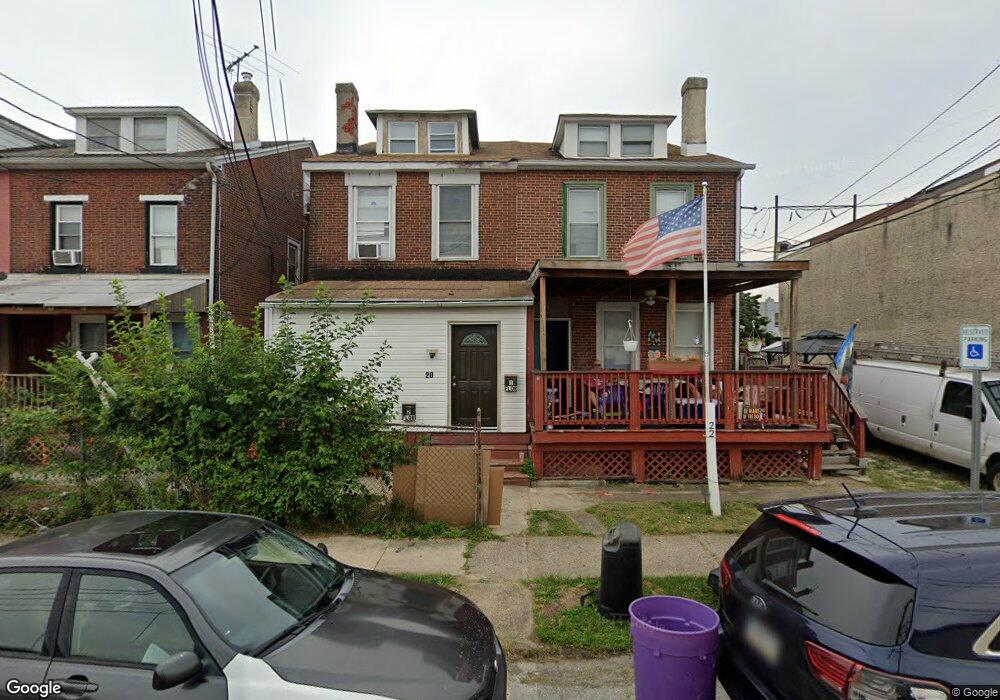
22 Second St Lansdowne, PA 19050
Estimated Value: $50,000 - $210,000
3
Beds
2
Baths
1,280
Sq Ft
$86/Sq Ft
Est. Value
About This Home
This home is located at 22 Second St, Lansdowne, PA 19050 and is currently estimated at $110,551, approximately $86 per square foot. 22 Second St is a home located in Delaware County with nearby schools including Charles Kelly El School, Upper Darby Kdg Center, and Upper Darby High School.
Ownership History
Date
Name
Owned For
Owner Type
Purchase Details
Closed on
Dec 9, 2025
Sold by
Harrell James and Harrell Tara
Bought by
Pampoukidou Despina and Deliopoulos Sofia
Current Estimated Value
Purchase Details
Closed on
Feb 5, 2003
Sold by
Harrell Tara and Paugh Tara
Bought by
Harrell James and Harrell Tara
Home Financials for this Owner
Home Financials are based on the most recent Mortgage that was taken out on this home.
Original Mortgage
$35,000
Interest Rate
5.99%
Mortgage Type
Purchase Money Mortgage
Purchase Details
Closed on
Jan 23, 1999
Sold by
Greed Mary G and Greed John T
Bought by
Paugh Tara
Home Financials for this Owner
Home Financials are based on the most recent Mortgage that was taken out on this home.
Original Mortgage
$24,300
Interest Rate
6.74%
Create a Home Valuation Report for This Property
The Home Valuation Report is an in-depth analysis detailing your home's value as well as a comparison with similar homes in the area
Home Values in the Area
Average Home Value in this Area
Purchase History
| Date | Buyer | Sale Price | Title Company |
|---|---|---|---|
| Pampoukidou Despina | $50,000 | Assured Settlement Services | |
| Harrell James | -- | T A Title Insurance Company | |
| Paugh Tara | $27,000 | Commonwealth Land Title Ins |
Source: Public Records
Mortgage History
| Date | Status | Borrower | Loan Amount |
|---|---|---|---|
| Previous Owner | Harrell James | $35,000 | |
| Previous Owner | Paugh Tara | $24,300 |
Source: Public Records
Tax History
| Year | Tax Paid | Tax Assessment Tax Assessment Total Assessment is a certain percentage of the fair market value that is determined by local assessors to be the total taxable value of land and additions on the property. | Land | Improvement |
|---|---|---|---|---|
| 2025 | $3,084 | $72,930 | $16,230 | $56,700 |
| 2024 | $3,084 | $72,930 | $16,230 | $56,700 |
| 2023 | $3,055 | $72,930 | $16,230 | $56,700 |
| 2022 | $2,973 | $72,930 | $16,230 | $56,700 |
| 2021 | $4,009 | $72,930 | $16,230 | $56,700 |
| 2020 | $2,791 | $43,150 | $14,750 | $28,400 |
| 2019 | $2,742 | $43,150 | $14,750 | $28,400 |
| 2018 | $2,711 | $43,150 | $0 | $0 |
| 2017 | $2,640 | $43,150 | $0 | $0 |
| 2016 | $237 | $43,150 | $0 | $0 |
| 2015 | $242 | $43,150 | $0 | $0 |
| 2014 | $237 | $43,150 | $0 | $0 |
Source: Public Records
Map
Nearby Homes
- 401 Holly Rd
- 436 Church Ln
- 438 Church Ln
- 442 Church Ln
- 22 Lexington Ave
- 417 Laurel Rd
- 57 Lexington Ave
- 530 Orchard Ave
- 104 Oak Ave
- 109 Lexington Ave
- 622 Yeadon Ave
- 7010 Atlantic Ave
- 7117 Atlantic Ave
- 86 Houston Rd
- 7123 Seaford Rd
- 81 Hartley Rd
- 192 Fairview Ave
- 46 S Maple Ave
- 408 S Union Ave
- 702 Cedar Ave
Your Personal Tour Guide
Ask me questions while you tour the home.