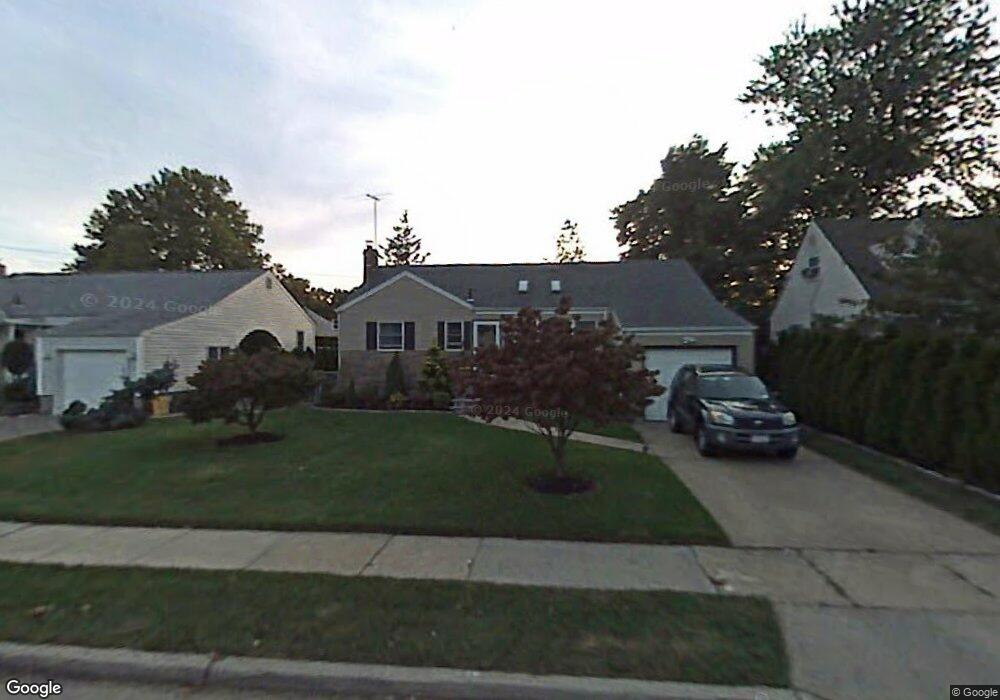
22 Shelly Ct Plainview, NY 11803
Estimated Value: $762,895 - $845,000
--
Bed
2
Baths
1,055
Sq Ft
$762/Sq Ft
Est. Value
About This Home
This home is located at 22 Shelly Ct, Plainview, NY 11803 and is currently estimated at $803,948, approximately $762 per square foot. 22 Shelly Ct is a home located in Nassau County with nearby schools including Pasadena Elementary School, Plainview Old Bethpage Middle School, and Plainview-Old Bethpage John F. Kennedy High School.
Ownership History
Date
Name
Owned For
Owner Type
Purchase Details
Closed on
May 2, 2011
Sold by
Lazaridis Bill and Neamonitakis Ploumitsa
Bought by
Oliva David M
Current Estimated Value
Home Financials for this Owner
Home Financials are based on the most recent Mortgage that was taken out on this home.
Original Mortgage
$285,000
Outstanding Balance
$16,743
Interest Rate
4.12%
Mortgage Type
Purchase Money Mortgage
Estimated Equity
$787,205
Purchase Details
Closed on
Apr 9, 2007
Sold by
Zhang Hai
Bought by
Lazaridis Bill
Purchase Details
Closed on
Aug 19, 2004
Sold by
Garaffa Dominick
Bought by
Wong Julia
Purchase Details
Closed on
Aug 18, 1999
Sold by
Mcdonough David J and Mcdonough Andrea
Bought by
Garaffa Dominick and Hayes Michele J
Home Financials for this Owner
Home Financials are based on the most recent Mortgage that was taken out on this home.
Original Mortgage
$199,600
Interest Rate
7.5%
Mortgage Type
Purchase Money Mortgage
Create a Home Valuation Report for This Property
The Home Valuation Report is an in-depth analysis detailing your home's value as well as a comparison with similar homes in the area
Home Values in the Area
Average Home Value in this Area
Purchase History
| Date | Buyer | Sale Price | Title Company |
|---|---|---|---|
| Oliva David M | $425,000 | -- | |
| Lazaridis Bill | $443,000 | -- | |
| Wong Julia | $440,000 | -- | |
| Garaffa Dominick | $249,500 | -- |
Source: Public Records
Mortgage History
| Date | Status | Borrower | Loan Amount |
|---|---|---|---|
| Open | Oliva David M | $285,000 | |
| Previous Owner | Garaffa Dominick | $199,600 |
Source: Public Records
Tax History Compared to Growth
Tax History
| Year | Tax Paid | Tax Assessment Tax Assessment Total Assessment is a certain percentage of the fair market value that is determined by local assessors to be the total taxable value of land and additions on the property. | Land | Improvement |
|---|---|---|---|---|
| 2025 | $14,498 | $522 | $284 | $238 |
| 2024 | $4,497 | $522 | $284 | $238 |
| 2023 | $13,066 | $522 | $284 | $238 |
| 2022 | $13,066 | $522 | $284 | $238 |
| 2021 | $12,906 | $511 | $278 | $233 |
| 2020 | $12,510 | $716 | $667 | $49 |
| 2019 | $12,227 | $767 | $587 | $180 |
| 2018 | $12,343 | $933 | $0 | $0 |
| 2017 | $9,079 | $933 | $714 | $219 |
| 2016 | $13,724 | $933 | $714 | $219 |
| 2015 | $4,188 | $933 | $676 | $257 |
| 2014 | $4,188 | $933 | $676 | $257 |
| 2013 | $3,814 | $933 | $714 | $219 |
Source: Public Records
Map
Nearby Homes