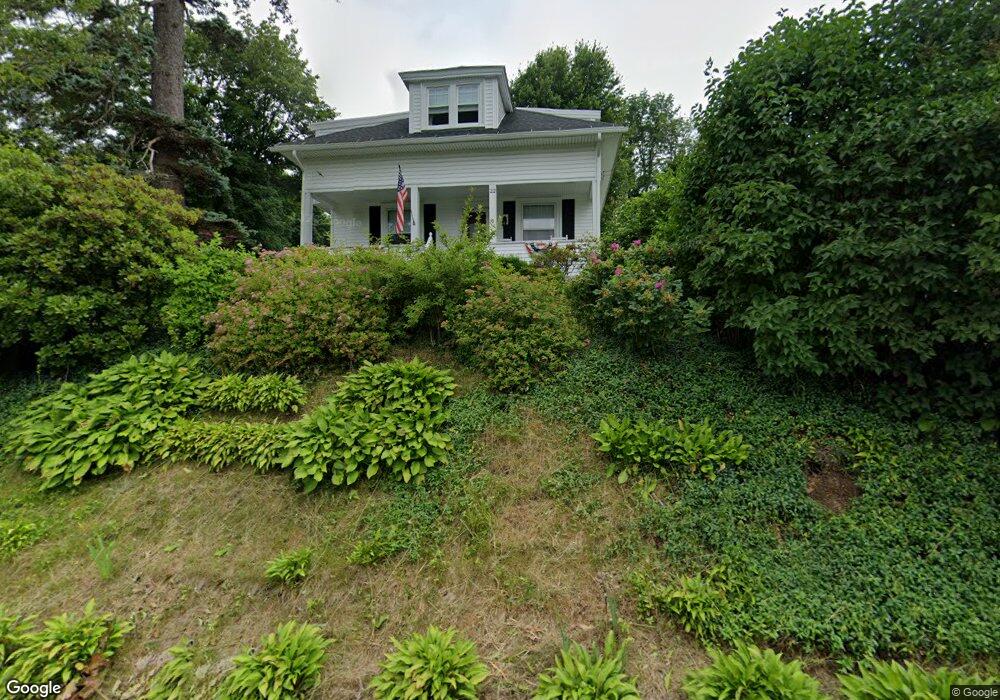
22 South St Auburn, MA 01501
Downtown Auburn NeighborhoodEstimated Value: $486,925 - $538,000
4
Beds
3
Baths
2,015
Sq Ft
$256/Sq Ft
Est. Value
About This Home
This home is located at 22 South St, Auburn, MA 01501 and is currently estimated at $515,231, approximately $255 per square foot. 22 South St is a home located in Worcester County with nearby schools including Auburn Senior High School and Shrewsbury Montessori School - Auburn Campus.
Ownership History
Date
Name
Owned For
Owner Type
Purchase Details
Closed on
Jan 12, 2015
Sold by
Benson James J and Benson Mary B
Bought by
Benson Irt
Current Estimated Value
Purchase Details
Closed on
Sep 8, 1987
Sold by
Kiritsy Frank M
Bought by
Benson James J
Home Financials for this Owner
Home Financials are based on the most recent Mortgage that was taken out on this home.
Original Mortgage
$30,000
Interest Rate
10.28%
Mortgage Type
Purchase Money Mortgage
Create a Home Valuation Report for This Property
The Home Valuation Report is an in-depth analysis detailing your home's value as well as a comparison with similar homes in the area
Home Values in the Area
Average Home Value in this Area
Purchase History
| Date | Buyer | Sale Price | Title Company |
|---|---|---|---|
| Benson Irt | -- | -- | |
| Benson James J | $132,500 | -- |
Source: Public Records
Mortgage History
| Date | Status | Borrower | Loan Amount |
|---|---|---|---|
| Previous Owner | Benson James J | $50,000 | |
| Previous Owner | Benson James J | $30,000 | |
| Previous Owner | Benson James J | $94,500 |
Source: Public Records
Tax History
| Year | Tax Paid | Tax Assessment Tax Assessment Total Assessment is a certain percentage of the fair market value that is determined by local assessors to be the total taxable value of land and additions on the property. | Land | Improvement |
|---|---|---|---|---|
| 2025 | $57 | $395,700 | $116,400 | $279,300 |
| 2024 | $5,685 | $380,800 | $111,600 | $269,200 |
| 2023 | $5,652 | $355,900 | $101,500 | $254,400 |
| 2022 | $5,305 | $315,400 | $101,500 | $213,900 |
| 2021 | $6,986 | $271,400 | $89,600 | $181,800 |
| 2020 | $4,691 | $260,900 | $89,600 | $171,300 |
| 2019 | $4,690 | $254,600 | $88,800 | $165,800 |
| 2018 | $3,281 | $245,300 | $83,000 | $162,300 |
| 2017 | $5,665 | $236,900 | $75,300 | $161,600 |
| 2016 | $4,101 | $226,700 | $78,100 | $148,600 |
| 2015 | $3,262 | $189,000 | $78,100 | $110,900 |
| 2014 | $3,192 | $184,600 | $74,400 | $110,200 |
Source: Public Records
Map
Nearby Homes
- 8 South Terrace
- 61 School St
- 6 George St
- 751 Washington St Unit 43A
- 166 Leicester St
- 634 Oxford St S
- 31 Walsh Ave
- 31-33 Walsh Ave
- 33 Walsh Ave
- 35 Waterman Rd
- 40 Bryn Mawr Ave
- 6 Buron Terrace
- 501 Forest Park Dr Unit 501
- 19-20 Williams St
- 49 Prospect St
- 808 Washington St
- 1-9 Helens Way
- 177 Oxford St N
- 0 Athens St
- 25 Vinal St Unit 28
Your Personal Tour Guide
Ask me questions while you tour the home.