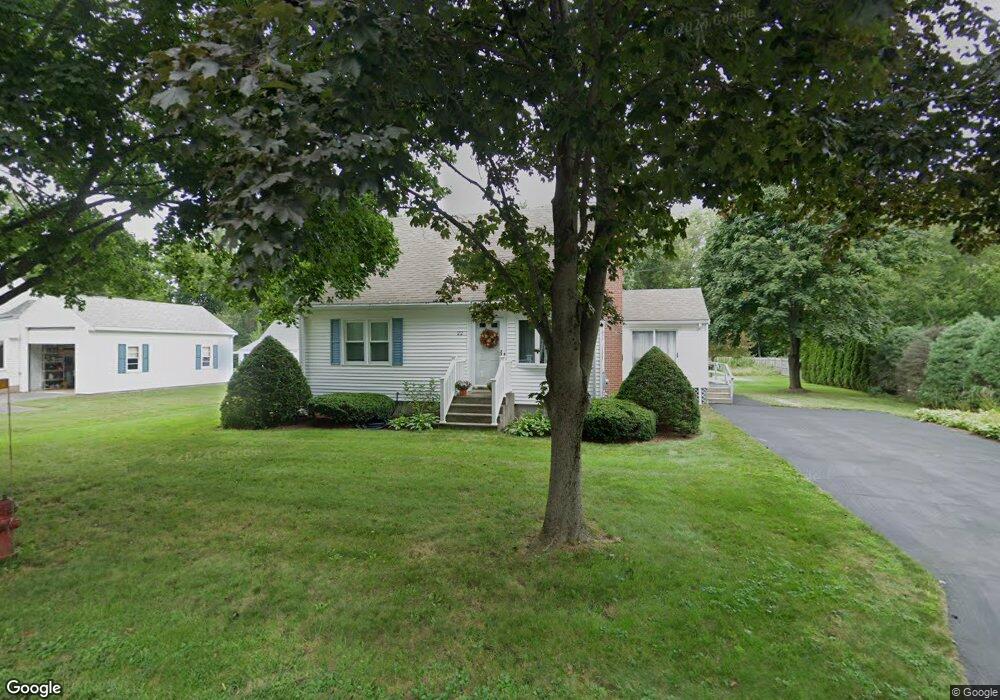
22 South St Wayland, MA 01778
Estimated Value: $873,000 - $1,027,000
4
Beds
2
Baths
1,718
Sq Ft
$544/Sq Ft
Est. Value
About This Home
This home is located at 22 South St, Wayland, MA 01778 and is currently estimated at $933,963, approximately $543 per square foot. 22 South St is a home located in Middlesex County with nearby schools including Wayland High School and Veritas Christian Academy.
Ownership History
Date
Name
Owned For
Owner Type
Purchase Details
Closed on
Mar 31, 2016
Sold by
Woodside Justin D
Bought by
Woodside Ft
Current Estimated Value
Purchase Details
Closed on
Sep 27, 2006
Sold by
Sun Yongqin and Li Zhuyou
Bought by
Woodside Justin Douglas
Home Financials for this Owner
Home Financials are based on the most recent Mortgage that was taken out on this home.
Original Mortgage
$307,500
Interest Rate
6.52%
Mortgage Type
Purchase Money Mortgage
Purchase Details
Closed on
Sep 26, 1997
Sold by
Halfpenny Fred N and Halfpenny Virginia A
Bought by
Li Zhuyou and Sun Yongqin
Home Financials for this Owner
Home Financials are based on the most recent Mortgage that was taken out on this home.
Original Mortgage
$183,750
Interest Rate
7.47%
Mortgage Type
Purchase Money Mortgage
Create a Home Valuation Report for This Property
The Home Valuation Report is an in-depth analysis detailing your home's value as well as a comparison with similar homes in the area
Home Values in the Area
Average Home Value in this Area
Purchase History
| Date | Buyer | Sale Price | Title Company |
|---|---|---|---|
| Woodside Ft | -- | -- | |
| Woodside Justin Douglas | $512,500 | -- | |
| Woodside Ft | -- | -- | |
| Woodside Justin Douglas | $512,500 | -- | |
| Li Zhuyou | $245,000 | -- |
Source: Public Records
Mortgage History
| Date | Status | Borrower | Loan Amount |
|---|---|---|---|
| Previous Owner | Woodside Justin Douglas | $307,500 | |
| Previous Owner | Li Zhuyou | $183,750 | |
| Previous Owner | Li Zhuyou | $185,000 |
Source: Public Records
Tax History Compared to Growth
Tax History
| Year | Tax Paid | Tax Assessment Tax Assessment Total Assessment is a certain percentage of the fair market value that is determined by local assessors to be the total taxable value of land and additions on the property. | Land | Improvement |
|---|---|---|---|---|
| 2025 | $13,356 | $854,500 | $476,000 | $378,500 |
| 2024 | $12,660 | $815,700 | $453,300 | $362,400 |
| 2023 | $12,358 | $742,200 | $412,100 | $330,100 |
| 2022 | $11,786 | $642,300 | $341,300 | $301,000 |
| 2021 | $11,319 | $611,200 | $310,200 | $301,000 |
| 2020 | $10,855 | $611,200 | $310,200 | $301,000 |
| 2019 | $10,458 | $572,100 | $295,400 | $276,700 |
| 2018 | $9,907 | $549,500 | $295,400 | $254,100 |
| 2017 | $9,703 | $534,900 | $281,300 | $253,600 |
| 2016 | $8,871 | $511,600 | $275,700 | $235,900 |
| 2015 | $9,202 | $500,400 | $275,700 | $224,700 |
Source: Public Records
Map
Nearby Homes