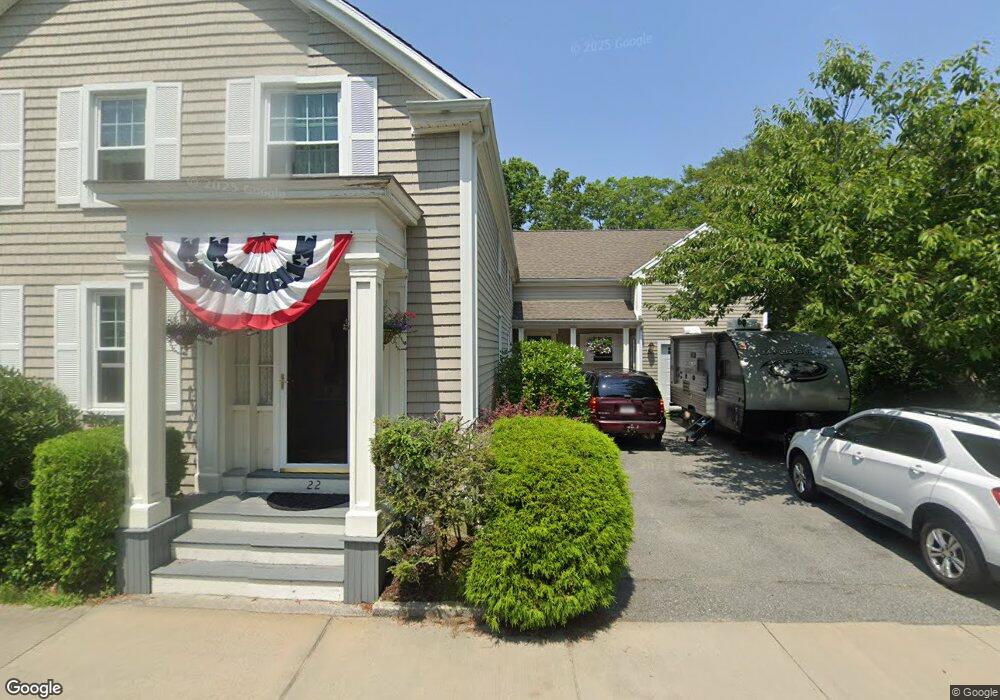
22 Spring St Fairhaven, MA 02719
Estimated Value: $497,000 - $639,000
4
Beds
3
Baths
2,560
Sq Ft
$227/Sq Ft
Est. Value
About This Home
This home is located at 22 Spring St, Fairhaven, MA 02719 and is currently estimated at $580,436, approximately $226 per square foot. 22 Spring St is a home located in Bristol County with nearby schools including Fairhaven High School, City On A Hill Charter Public School New Bedford, and St. Joseph School.
Ownership History
Date
Name
Owned For
Owner Type
Purchase Details
Closed on
Apr 1, 2015
Sold by
Paul B Dawson Lt
Bought by
Dawson Paul B and Dawson Theresa M
Current Estimated Value
Home Financials for this Owner
Home Financials are based on the most recent Mortgage that was taken out on this home.
Original Mortgage
$135,000
Outstanding Balance
$103,963
Interest Rate
3.75%
Estimated Equity
$476,473
Purchase Details
Closed on
Jan 28, 2011
Sold by
Dawson Paul B and Dawson Theresa M
Bought by
Paul B Dawson Lt and Dawson Paul B
Home Financials for this Owner
Home Financials are based on the most recent Mortgage that was taken out on this home.
Original Mortgage
$80,000
Interest Rate
4.84%
Mortgage Type
Unknown
Purchase Details
Closed on
Feb 1, 1983
Bought by
Lt Paul B Dawson
Create a Home Valuation Report for This Property
The Home Valuation Report is an in-depth analysis detailing your home's value as well as a comparison with similar homes in the area
Home Values in the Area
Average Home Value in this Area
Purchase History
| Date | Buyer | Sale Price | Title Company |
|---|---|---|---|
| Dawson Paul B | -- | -- | |
| Paul B Dawson Lt | -- | -- | |
| Lt Paul B Dawson | $49,500 | -- |
Source: Public Records
Mortgage History
| Date | Status | Borrower | Loan Amount |
|---|---|---|---|
| Open | Dawson Paul B | $135,000 | |
| Previous Owner | Lt Paul B Dawson | $80,000 | |
| Previous Owner | Lt Paul B Dawson | $85,000 | |
| Previous Owner | Lt Paul B Dawson | $55,000 |
Source: Public Records
Tax History Compared to Growth
Tax History
| Year | Tax Paid | Tax Assessment Tax Assessment Total Assessment is a certain percentage of the fair market value that is determined by local assessors to be the total taxable value of land and additions on the property. | Land | Improvement |
|---|---|---|---|---|
| 2025 | $46 | $497,300 | $178,900 | $318,400 |
| 2024 | $4,576 | $495,800 | $178,900 | $316,900 |
| 2023 | $4,427 | $444,900 | $156,700 | $288,200 |
| 2022 | $4,238 | $414,700 | $145,600 | $269,100 |
| 2021 | $4,317 | $363,500 | $131,800 | $231,700 |
| 2020 | $0 | $363,500 | $131,800 | $231,700 |
| 2019 | $1,683 | $330,700 | $109,300 | $221,400 |
| 2018 | $0 | $311,600 | $104,000 | $207,600 |
| 2017 | $1,461 | $299,300 | $104,000 | $195,300 |
| 2016 | $3,345 | $274,600 | $104,000 | $170,600 |
| 2015 | $3,251 | $267,600 | $104,000 | $163,600 |
Source: Public Records
Map
Nearby Homes