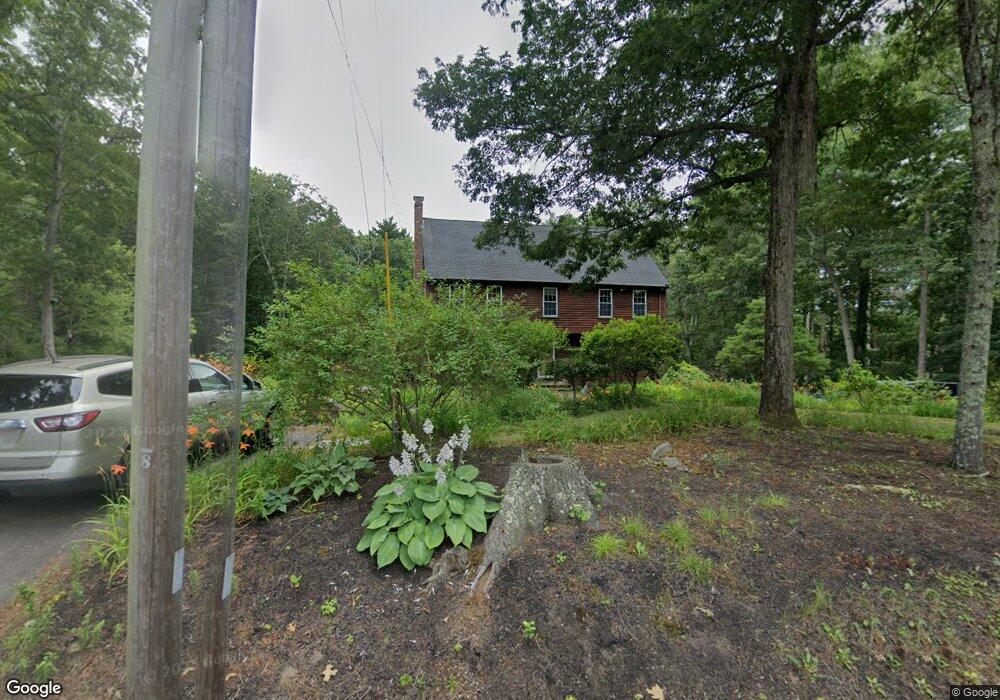
22 Spruce St Foxboro, MA 02035
Estimated Value: $826,000 - $975,000
4
Beds
3
Baths
2,347
Sq Ft
$371/Sq Ft
Est. Value
About This Home
This home is located at 22 Spruce St, Foxboro, MA 02035 and is currently estimated at $871,032, approximately $371 per square foot. 22 Spruce St is a home located in Norfolk County with nearby schools including Foxborough High School, Foxborough Regional Charter School, and Hands-On-Montessori School.
Ownership History
Date
Name
Owned For
Owner Type
Purchase Details
Closed on
Mar 3, 2008
Sold by
Prudential Relocation
Bought by
Kelley James M and Kelley Lisa M
Current Estimated Value
Home Financials for this Owner
Home Financials are based on the most recent Mortgage that was taken out on this home.
Original Mortgage
$387,000
Outstanding Balance
$241,870
Interest Rate
5.8%
Estimated Equity
$629,162
Purchase Details
Closed on
May 19, 2003
Sold by
Puckett Helen V and Puckett John L
Bought by
Lim Sim S and Yeoh Thean Y
Home Financials for this Owner
Home Financials are based on the most recent Mortgage that was taken out on this home.
Original Mortgage
$205,000
Interest Rate
5.84%
Mortgage Type
Purchase Money Mortgage
Create a Home Valuation Report for This Property
The Home Valuation Report is an in-depth analysis detailing your home's value as well as a comparison with similar homes in the area
Home Values in the Area
Average Home Value in this Area
Purchase History
| Date | Buyer | Sale Price | Title Company |
|---|---|---|---|
| Kelley James M | $430,000 | -- | |
| Relocation Prudential | $430,000 | -- | |
| Lim Sim S | $452,000 | -- |
Source: Public Records
Mortgage History
| Date | Status | Borrower | Loan Amount |
|---|---|---|---|
| Open | Relocation Prudential | $387,000 | |
| Closed | Kelley James M | $387,000 | |
| Previous Owner | Lim Sim S | $205,000 |
Source: Public Records
Tax History
| Year | Tax Paid | Tax Assessment Tax Assessment Total Assessment is a certain percentage of the fair market value that is determined by local assessors to be the total taxable value of land and additions on the property. | Land | Improvement |
|---|---|---|---|---|
| 2025 | $9,534 | $721,200 | $265,700 | $455,500 |
| 2024 | $9,150 | $677,300 | $265,400 | $411,900 |
| 2023 | $8,567 | $602,900 | $253,000 | $349,900 |
| 2022 | $8,448 | $581,800 | $242,300 | $339,500 |
| 2021 | $8,058 | $546,700 | $220,600 | $326,100 |
| 2020 | $7,814 | $536,300 | $220,600 | $315,700 |
| 2019 | $7,469 | $508,100 | $210,200 | $297,900 |
| 2018 | $7,288 | $500,200 | $210,200 | $290,000 |
| 2017 | $6,917 | $459,900 | $196,600 | $263,300 |
| 2016 | $6,710 | $452,800 | $189,500 | $263,300 |
| 2015 | $6,637 | $436,900 | $160,500 | $276,400 |
| 2014 | $6,425 | $428,600 | $157,400 | $271,200 |
Source: Public Records
Map
Nearby Homes
- 346 South St
- 40 Treasure Island Rd
- 16 Treasure Island Rd
- 46 Mirimichi St
- 33 Colonial Way
- 1769 West St
- 128 Tremont St
- 155 South St
- 9 Coach Rd
- 483 Thurston St
- 24 Maverick Dr
- 84 Messenger St
- 126 Washington St
- 130 Washington St
- 124 Washington St
- 160 Washington St Unit 22
- 158 Washington St
- 356 Central St
- 67 Carpenter St
- 85 Jewell St
Your Personal Tour Guide
Ask me questions while you tour the home.