
Seller's Agent in 2016
Nancy Reed
Coldwell Banker Realty - Duxbury
(617) 347-6420
21 in this area
47 Total Sales
Estimated Value: $1,246,717 - $1,591,000
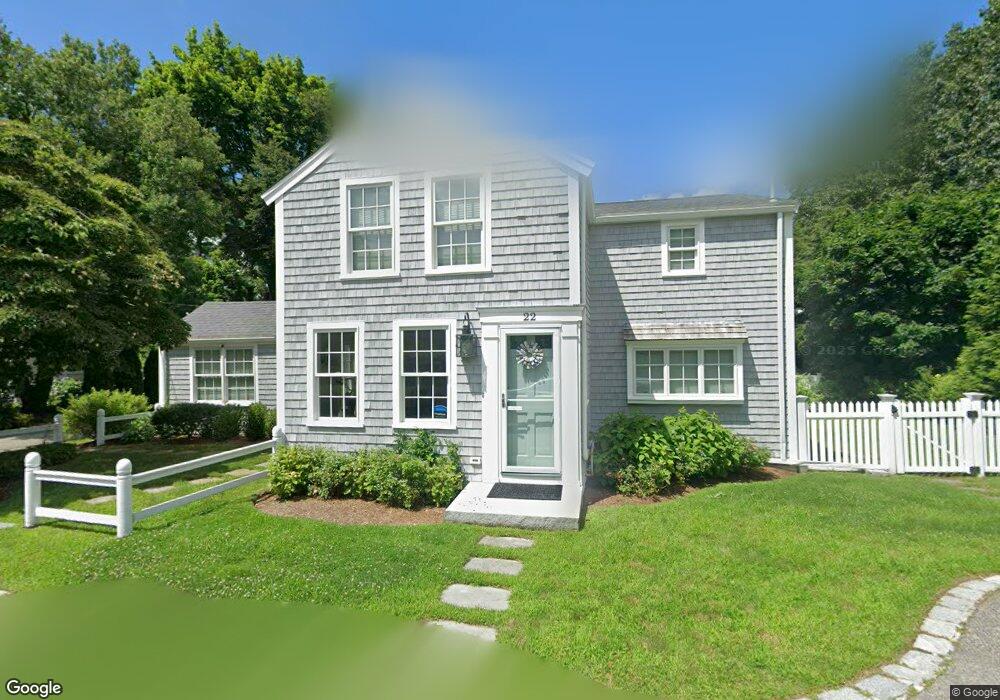
This home is located at 22 Stetson Place, Duxbury, MA 02332 and is currently estimated at $1,368,929, approximately $702 per square foot. 22 Stetson Place is a home located in Plymouth County with nearby schools including Chandler Elementary School, Alden School, and Duxbury Middle School.
| Date | Buyer | Sale Price | Title Company |
|---|---|---|---|
| Gates Ft | -- | None Available | |
| Hamilton B Bowman T B | -- | -- | |
| Bowman Hamilton B | $247,500 | -- | |
| Bowman Hamilton B | $247,500 | -- |
| Date | Event | Price | List to Sale | Price per Sq Ft | Prior Sale |
|---|---|---|---|---|---|
| 10/31/2016 10/31/16 | Sold | $586,500 | -6.2% | $301 / Sq Ft | View Prior Sale |
| 09/19/2016 09/19/16 | Pending | -- | -- | -- | |
| 09/13/2016 09/13/16 | For Sale | $625,000 | 0.0% | $321 / Sq Ft | |
| 09/02/2016 09/02/16 | Pending | -- | -- | -- | |
| 08/12/2016 08/12/16 | Price Changed | $625,000 | -1.6% | $321 / Sq Ft | |
| 05/17/2016 05/17/16 | Price Changed | $635,000 | -2.3% | $326 / Sq Ft | |
| 03/16/2016 03/16/16 | Price Changed | $650,000 | -3.7% | $333 / Sq Ft | |
| 02/26/2016 02/26/16 | Price Changed | $675,000 | -3.6% | $346 / Sq Ft | |
| 02/10/2016 02/10/16 | For Sale | $699,900 | -- | $359 / Sq Ft |
| Year | Tax Paid | Tax Assessment Tax Assessment Total Assessment is a certain percentage of the fair market value that is determined by local assessors to be the total taxable value of land and additions on the property. | Land | Improvement |
|---|---|---|---|---|
| 2025 | $11,119 | $1,096,500 | $803,600 | $292,900 |
| 2024 | $11,816 | $1,174,600 | $884,800 | $289,800 |
| 2023 | $10,927 | $1,022,200 | $734,900 | $287,300 |
| 2022 | $9,706 | $755,900 | $497,500 | $258,400 |
| 2021 | $10,557 | $729,100 | $471,300 | $257,800 |
| 2020 | $10,228 | $697,700 | $440,500 | $257,200 |
| 2019 | $10,079 | $686,600 | $426,500 | $260,100 |
| 2018 | $8,076 | $532,700 | $397,600 | $135,100 |
| 2017 | $8,535 | $550,300 | $341,100 | $209,200 |
| 2016 | $8,557 | $550,300 | $341,100 | $209,200 |
| 2015 | $8,585 | $550,300 | $341,100 | $209,200 |
Seller's Agent in 2016
Nancy Reed
Coldwell Banker Realty - Duxbury
(617) 347-6420
21 in this area
47 Total Sales
Buyer's Agent in 2016
Team Hallowell Devnew
Waterfront Realty Group
(781) 929-2214
28 in this area
54 Total Sales