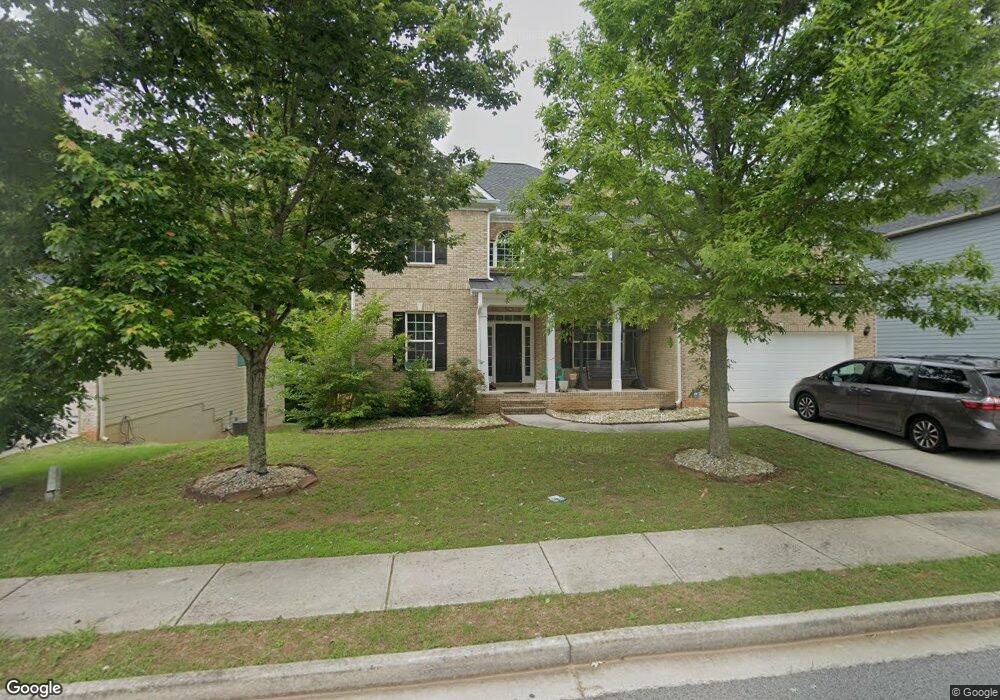
22 Stonesthrow Ln Newnan, GA 30265
Estimated Value: $445,656 - $544,000
4
Beds
3
Baths
3,050
Sq Ft
$160/Sq Ft
Est. Value
About This Home
This home is located at 22 Stonesthrow Ln, Newnan, GA 30265 and is currently estimated at $487,164, approximately $159 per square foot. 22 Stonesthrow Ln is a home with nearby schools including Newnan Crossing Elementary School, Arnall Middle School, and East Coweta High School.
Ownership History
Date
Name
Owned For
Owner Type
Purchase Details
Closed on
Jun 25, 2010
Sold by
Pmc Residential Llc
Bought by
Patel Mukeshkumar G and Patel Llaben M
Current Estimated Value
Purchase Details
Closed on
Feb 28, 2010
Sold by
Patrick Malloy Communities Llc
Bought by
Pmc Residential Llc
Purchase Details
Closed on
Jan 21, 2010
Sold by
Stonebridge At Newnan Crossing Llc
Bought by
Patrick Malloy Communities Llc
Purchase Details
Closed on
Jun 19, 2003
Sold by
Newnan Crossing Partnersh
Bought by
Stonebridge At Newnan Crossing Llc
Purchase Details
Closed on
Apr 4, 2001
Sold by
Lewisphthe Salvation Army
Bought by
Newnan Crossing Partnersh
Purchase Details
Closed on
Apr 17, 1989
Bought by
Newnan Crossing Part
Purchase Details
Closed on
Apr 5, 1989
Bought by
Signa Development Co
Create a Home Valuation Report for This Property
The Home Valuation Report is an in-depth analysis detailing your home's value as well as a comparison with similar homes in the area
Home Values in the Area
Average Home Value in this Area
Purchase History
| Date | Buyer | Sale Price | Title Company |
|---|---|---|---|
| Patel Mukeshkumar G | $270,700 | -- | |
| Pmc Residential Llc | -- | -- | |
| Patrick Malloy Communities Llc | $48,000 | -- | |
| Stonebridge At Newnan Crossing Llc | $6,921,900 | -- | |
| Newnan Crossing Partnersh | -- | -- | |
| Newnan Crossing Part | -- | -- | |
| Signa Development Co | -- | -- |
Source: Public Records
Tax History Compared to Growth
Tax History
| Year | Tax Paid | Tax Assessment Tax Assessment Total Assessment is a certain percentage of the fair market value that is determined by local assessors to be the total taxable value of land and additions on the property. | Land | Improvement |
|---|---|---|---|---|
| 2025 | $4,706 | $202,680 | $30,000 | $172,680 |
| 2024 | $4,370 | $194,655 | $30,000 | $164,655 |
| 2023 | $4,370 | $197,717 | $26,000 | $171,717 |
| 2022 | $4,405 | $184,539 | $26,000 | $158,539 |
| 2021 | $3,900 | $148,677 | $16,000 | $132,677 |
| 2020 | $3,986 | $148,677 | $16,000 | $132,677 |
| 2019 | $3,507 | $120,474 | $16,000 | $104,474 |
| 2018 | $3,527 | $120,474 | $16,000 | $104,474 |
| 2017 | $3,381 | $116,121 | $16,000 | $100,121 |
| 2016 | $3,096 | $106,544 | $16,000 | $90,544 |
| 2015 | $2,920 | $100,544 | $10,000 | $90,544 |
| 2014 | $2,862 | $97,062 | $10,000 | $87,062 |
Source: Public Records
Map
Nearby Homes
- 80 Creekside Way
- 24 Stonebridge Pass
- 152 Stonebridge Crossing
- 49 Granite Way
- 8 Bryce Creek Dr
- 186 Granite Way
- 112 Granite Way
- 361 Granite Way
- 9 Ravine Dr
- 20 Bryce Creek Dr
- 35 Canyon View Dr
- 23 Carrington Way
- 32 October Ave
- 16 Daybreak Ln
- 274 Daybreak Ln
- 212 Daybreak Ln
- 206 Daybreak Ln
- 204 Daybreak Ln
- 165 Arbor Garden Cir
- 309 Daybreak Ln
- 26 Stonesthrow Ln Unit 20
- 26 Stonesthrow Ln
- 18 Stonesthrow Ln
- 30 Stonesthrow Ln
- 14 Stonesthrow Ln
- 23 Stonesthrow Ln
- 19 Stonesthrow Ln
- 27 Stonesthrow Ln
- 15 Stonesthrow Ln
- 34 Stonesthrow Ln
- 11 Stonesthrow Ln
- 35 Stonebridge Way
- 39 Stonebridge Way
- 42 Stonesthrow Ln Unit 16
- 42 Stonesthrow Ln
- 6 Stonesthrow Ln
- 38 Stonesthrow Ln
- 45 Stonesthrow Ln
- 31 Stonebridge Blvd
- 43 Stonebridge Way