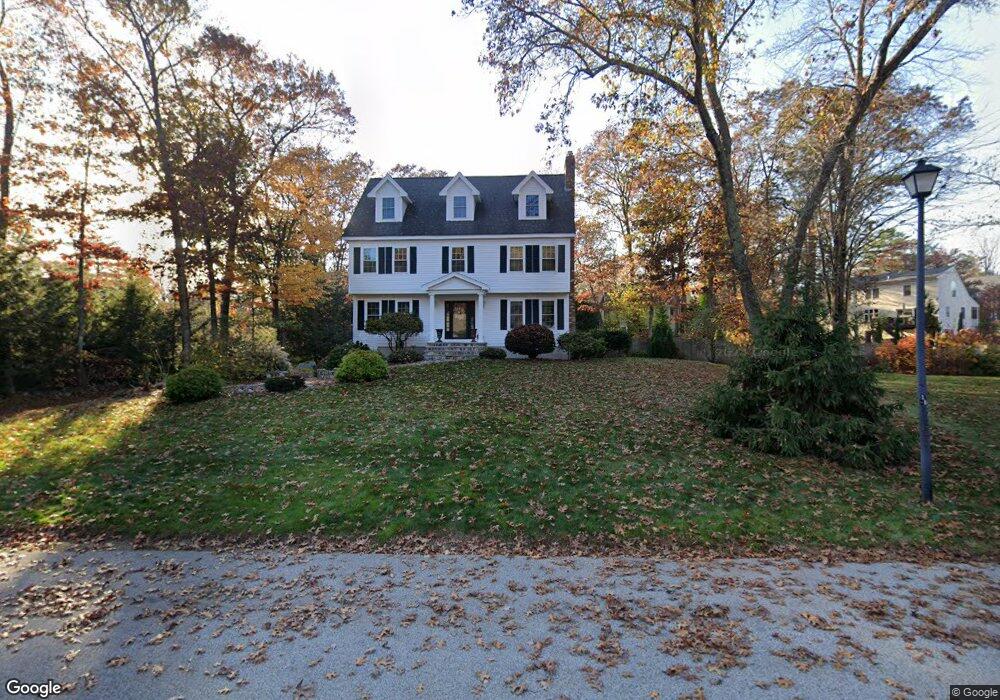
22 Storeybrook Dr Newburyport, MA 01950
Estimated Value: $1,161,926 - $1,370,000
5
Beds
3
Baths
2,560
Sq Ft
$491/Sq Ft
Est. Value
About This Home
This home is located at 22 Storeybrook Dr, Newburyport, MA 01950 and is currently estimated at $1,256,232, approximately $490 per square foot. 22 Storeybrook Dr is a home located in Essex County with nearby schools including Francis T. Bresnahan Elementary School, Edward G. Molin Elementary School, and Rupert A. Nock Middle School.
Ownership History
Date
Name
Owned For
Owner Type
Purchase Details
Closed on
Oct 27, 2009
Sold by
Wahlgren Mark A and Wahlgren Linda P
Bought by
Salah Linda
Current Estimated Value
Home Financials for this Owner
Home Financials are based on the most recent Mortgage that was taken out on this home.
Original Mortgage
$300,000
Interest Rate
5.09%
Mortgage Type
Purchase Money Mortgage
Purchase Details
Closed on
Dec 24, 2008
Sold by
Busch Prop Inc
Bought by
Wahlgren Mark A
Purchase Details
Closed on
Aug 18, 2008
Sold by
Wahlgren Linda P and Wahlgren Mark A
Bought by
Busch Prop Inc
Purchase Details
Closed on
Aug 26, 1997
Sold by
Gunnell Doyle L and Gunnell Paula F
Bought by
Wahlgren Mark A and Wahlgren Linda P
Purchase Details
Closed on
Jul 30, 1993
Sold by
Old County Nt
Bought by
Gunnell Doyle L and Gunnell Paula F
Create a Home Valuation Report for This Property
The Home Valuation Report is an in-depth analysis detailing your home's value as well as a comparison with similar homes in the area
Home Values in the Area
Average Home Value in this Area
Purchase History
| Date | Buyer | Sale Price | Title Company |
|---|---|---|---|
| Salah Linda | $520,000 | -- | |
| Wahlgren Mark A | $512,900 | -- | |
| Busch Prop Inc | $585,000 | -- | |
| Wahlgren Mark A | $275,000 | -- | |
| Gunnell Doyle L | $234,900 | -- |
Source: Public Records
Mortgage History
| Date | Status | Borrower | Loan Amount |
|---|---|---|---|
| Open | Gunnell Doyle L | $290,000 | |
| Closed | Gunnell Doyle L | $300,000 |
Source: Public Records
Tax History Compared to Growth
Tax History
| Year | Tax Paid | Tax Assessment Tax Assessment Total Assessment is a certain percentage of the fair market value that is determined by local assessors to be the total taxable value of land and additions on the property. | Land | Improvement |
|---|---|---|---|---|
| 2025 | $9,923 | $1,035,800 | $488,600 | $547,200 |
| 2024 | $9,613 | $964,200 | $444,100 | $520,100 |
| 2023 | $8,685 | $808,700 | $386,200 | $422,500 |
| 2022 | $8,548 | $711,700 | $321,800 | $389,900 |
| 2021 | $8,339 | $659,700 | $292,600 | $367,100 |
| 2020 | $8,259 | $643,200 | $292,600 | $350,600 |
| 2019 | $8,013 | $612,600 | $292,600 | $320,000 |
| 2018 | $7,606 | $573,600 | $278,700 | $294,900 |
| 2017 | $7,605 | $565,400 | $265,500 | $299,900 |
| 2016 | $7,233 | $540,200 | $252,800 | $287,400 |
| 2015 | $7,249 | $543,400 | $252,800 | $290,600 |
Source: Public Records
Map
Nearby Homes
- 7 Frances Dr
- 232 Low St Unit 7
- 17 Alberta Ave
- 8 Hart Rd
- 42 Myrtle Ave
- 8 Brown Ave
- 61 Spofford St
- 6 Storey Ave
- 138 Low St
- 110 Low St
- 287 1/2 High St
- 510 Merrimac St Unit 512
- 572 Merrimac St
- 492 Merrimac St
- 19 Jefferson St
- 1 Jefferson St
- 28 Beacon St
- 60 Merrimac St Unit 907
- 60 Merrimac St Unit 604
- 8 Riverview Heights
- 22 Storeybrooke Rd
- 24 Storeybrook Dr
- 20 Storeybrook Dr
- 19 Virginia Ln
- 21 Virginia Ln
- 17 Virginia Ln
- 23 Storeybrook Dr
- 25 Storeybrook Dr
- 18 Storeybrook Dr
- 23 Virginia Ln
- 18 Storeybrooke Rd
- 26 Storeybrook Dr
- 15 Virginia Ln
- 16 Storeybrook Dr
- Lot 9 Gabaree Ct
- 25 Virginia Ln
- 16 Virginia Ln
- 18 Virginia Ln
- 27 Storeybrook Dr
- 22 Virginia Ln