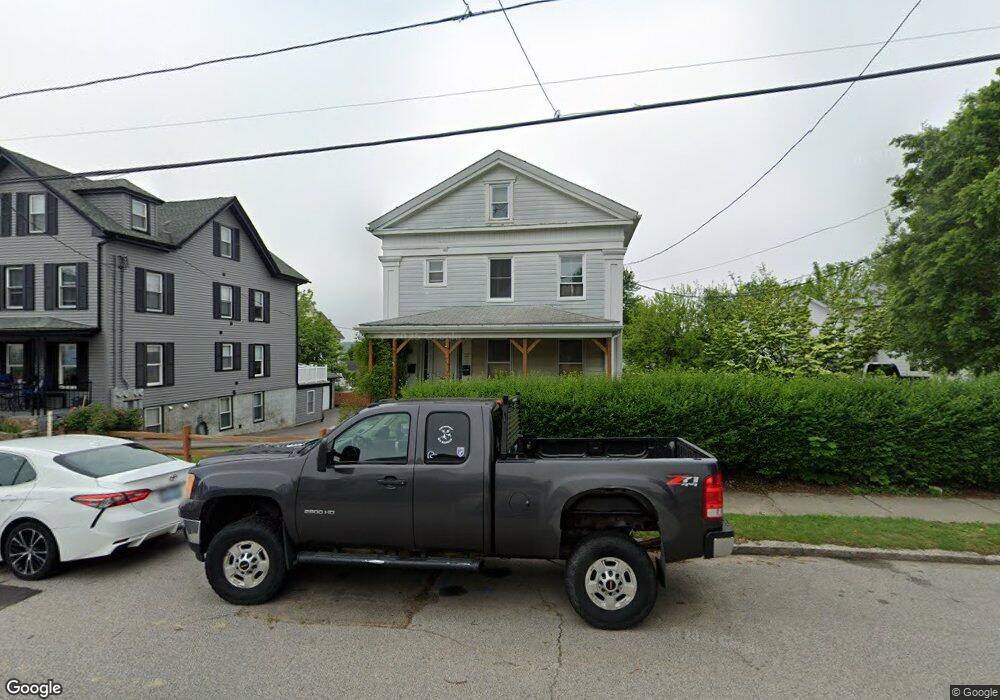
22 Summer St Westerly, RI 02891
Estimated Value: $484,000 - $596,000
5
Beds
2
Baths
2,088
Sq Ft
$253/Sq Ft
Est. Value
About This Home
This home is located at 22 Summer St, Westerly, RI 02891 and is currently estimated at $528,771, approximately $253 per square foot. 22 Summer St is a home located in Washington County with nearby schools including Westerly High School and St. Michael School.
Ownership History
Date
Name
Owned For
Owner Type
Purchase Details
Closed on
Sep 26, 2024
Sold by
Lepikko James A and Comstock Mary F
Bought by
22 Summer St Rt and Lepikko
Current Estimated Value
Purchase Details
Closed on
Jun 3, 2016
Sold by
Lepikko James A and Mostock Mary-Frances
Bought by
Lepikko James A and Mostock Mary Frances
Purchase Details
Closed on
Jun 15, 2011
Sold by
Lepikko James A
Bought by
Lepikko James A and Comstock Mary F
Home Financials for this Owner
Home Financials are based on the most recent Mortgage that was taken out on this home.
Original Mortgage
$174,528
Interest Rate
4.85%
Mortgage Type
Purchase Money Mortgage
Purchase Details
Closed on
Jun 1, 2011
Sold by
Wanchin Yim K and Chin Kathy
Bought by
Lepikko James A
Home Financials for this Owner
Home Financials are based on the most recent Mortgage that was taken out on this home.
Original Mortgage
$174,528
Interest Rate
4.85%
Mortgage Type
Purchase Money Mortgage
Create a Home Valuation Report for This Property
The Home Valuation Report is an in-depth analysis detailing your home's value as well as a comparison with similar homes in the area
Home Values in the Area
Average Home Value in this Area
Purchase History
| Date | Buyer | Sale Price | Title Company |
|---|---|---|---|
| 22 Summer St Rt | -- | None Available | |
| Lepikko James A | -- | -- | |
| Lepikko James A | -- | -- | |
| Lepikko James A | $192,000 | -- |
Source: Public Records
Mortgage History
| Date | Status | Borrower | Loan Amount |
|---|---|---|---|
| Previous Owner | Lepikko James A | $174,528 |
Source: Public Records
Tax History
| Year | Tax Paid | Tax Assessment Tax Assessment Total Assessment is a certain percentage of the fair market value that is determined by local assessors to be the total taxable value of land and additions on the property. | Land | Improvement |
|---|---|---|---|---|
| 2025 | $3,246 | $417,200 | $152,900 | $264,300 |
| 2024 | $2,836 | $271,400 | $109,500 | $161,900 |
| 2023 | $2,757 | $271,400 | $109,500 | $161,900 |
| 2022 | $2,741 | $271,400 | $109,500 | $161,900 |
| 2021 | $2,891 | $239,700 | $95,400 | $144,300 |
| 2020 | $2,840 | $239,700 | $95,400 | $144,300 |
| 2019 | $2,814 | $239,700 | $95,400 | $144,300 |
| 2018 | $2,853 | $231,000 | $95,400 | $135,600 |
| 2017 | $2,772 | $231,000 | $95,400 | $135,600 |
| 2016 | $2,766 | $230,500 | $95,400 | $135,100 |
| 2015 | $2,650 | $236,000 | $97,300 | $138,700 |
| 2014 | $2,608 | $236,000 | $97,300 | $138,700 |
Source: Public Records
Map
Nearby Homes
- 14 George St
- 16 Spring St
- 25 School St Unit 2
- 52 Bellevue Ave
- 7 Dixon St
- 17 West St Unit 3
- 38 Prospect St Unit B
- 13 Moss St
- 55 Pleasant St
- 141 W Broad St
- 12 Batterson Ave
- 5 Marion St
- 2 Marichris Dr
- 21 North Dr
- 12 Apache Dr Unit A
- 0 Iroquois Ave
- 19 Apache Dr Unit F
- 19 Apache Dr Unit 19C
- 199 High St
- 17 Apache Dr Unit G
Your Personal Tour Guide
Ask me questions while you tour the home.