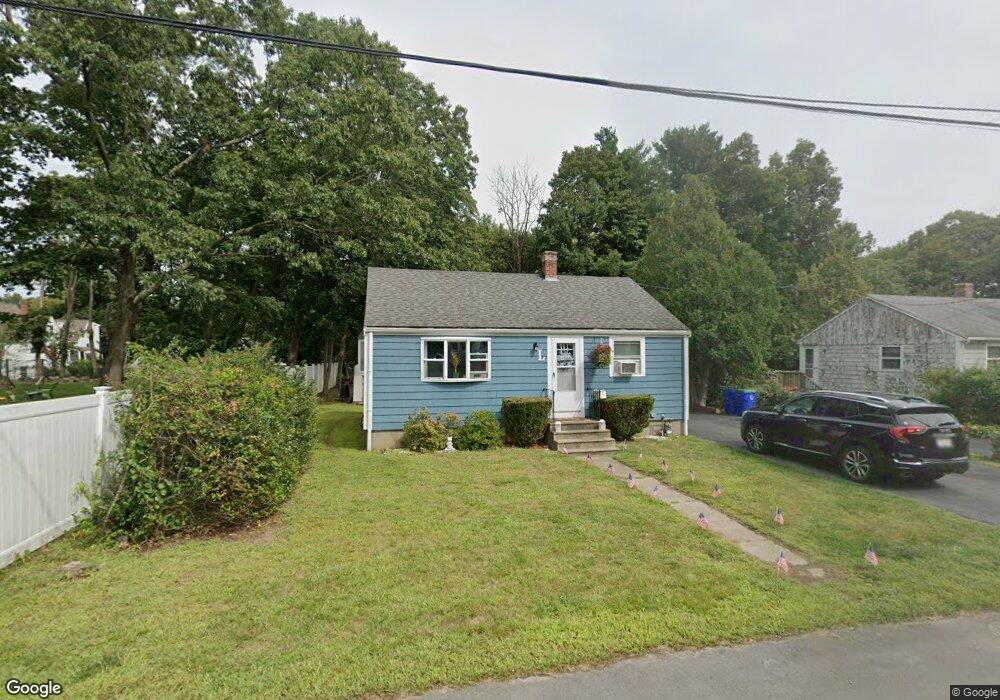
22 Sunset St Rockland, MA 02370
Estimated Value: $395,000 - $472,000
2
Beds
1
Bath
720
Sq Ft
$611/Sq Ft
Est. Value
About This Home
This home is located at 22 Sunset St, Rockland, MA 02370 and is currently estimated at $439,784, approximately $610 per square foot. 22 Sunset St is a home located in Plymouth County with nearby schools including Rockland Senior High School, Calvary Chapel Academy, and Holy Family Elementary School.
Ownership History
Date
Name
Owned For
Owner Type
Purchase Details
Closed on
Jan 31, 2018
Sold by
Vacari Robert G and Vacari Isabelle J
Bought by
Lincoln Michael D and Aldssarre Bianca L
Current Estimated Value
Home Financials for this Owner
Home Financials are based on the most recent Mortgage that was taken out on this home.
Original Mortgage
$207,000
Outstanding Balance
$175,090
Interest Rate
3.94%
Mortgage Type
New Conventional
Estimated Equity
$264,694
Purchase Details
Closed on
Sep 30, 1966
Bought by
Vacari Robert G and Vacari Isabelle J
Create a Home Valuation Report for This Property
The Home Valuation Report is an in-depth analysis detailing your home's value as well as a comparison with similar homes in the area
Home Values in the Area
Average Home Value in this Area
Purchase History
| Date | Buyer | Sale Price | Title Company |
|---|---|---|---|
| Lincoln Michael D | $230,000 | -- | |
| Vacari Robert G | -- | -- |
Source: Public Records
Mortgage History
| Date | Status | Borrower | Loan Amount |
|---|---|---|---|
| Open | Lincoln Michael D | $207,000 |
Source: Public Records
Tax History
| Year | Tax Paid | Tax Assessment Tax Assessment Total Assessment is a certain percentage of the fair market value that is determined by local assessors to be the total taxable value of land and additions on the property. | Land | Improvement |
|---|---|---|---|---|
| 2025 | $5,257 | $384,600 | $223,900 | $160,700 |
| 2024 | $5,102 | $362,900 | $211,200 | $151,700 |
| 2023 | $5,068 | $333,000 | $193,700 | $139,300 |
| 2022 | $4,851 | $289,600 | $168,400 | $121,200 |
| 2021 | $4,476 | $259,000 | $153,100 | $105,900 |
| 2020 | $4,319 | $246,800 | $145,900 | $100,900 |
| 2019 | $4,215 | $235,200 | $138,900 | $96,300 |
| 2018 | $3,934 | $215,900 | $138,900 | $77,000 |
| 2017 | $3,862 | $209,000 | $138,900 | $70,100 |
| 2016 | $3,716 | $201,000 | $133,600 | $67,400 |
| 2015 | $3,561 | $187,100 | $124,900 | $62,200 |
| 2014 | $3,364 | $183,400 | $122,400 | $61,000 |
Source: Public Records
Map
Nearby Homes
- 11 Chestnut Cir
- 9 Chestnut Cir
- 6 Chestnut Cir
- 119 Grove St Unit 234
- 135 Grove St Unit 123
- 135 Grove St Unit 115
- 135 Grove St Unit 133
- 103 Grove St Unit 349
- 1 Canterbury Ln
- 17 Birch St Unit 135
- 30 Leisurewoods Dr
- 50 Linden Park
- 40 Fir Rd Unit 386
- 225 W Water St
- 19 Dyer St Unit 19
- 0 W Water St
- 63 Webster St
- 9 Juniper Cir
- 3 Hickory Cir
- 86 Leisurewoods Dr Unit 279
Your Personal Tour Guide
Ask me questions while you tour the home.