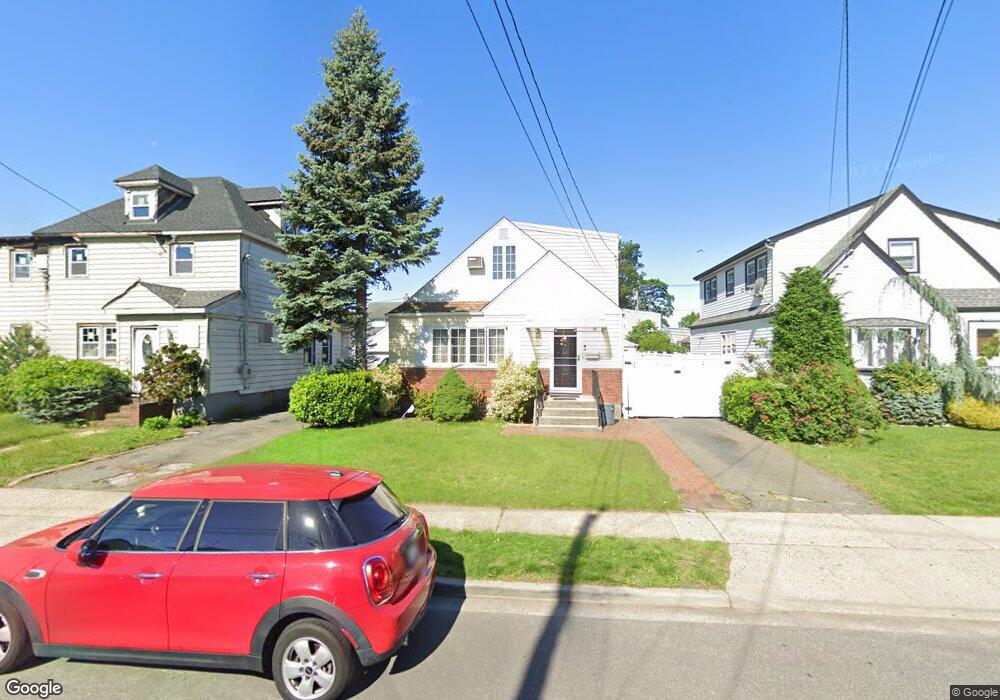
22 Sycamore St West Hempstead, NY 11552
Estimated Value: $706,000 - $730,786
3
Beds
2
Baths
1,517
Sq Ft
$474/Sq Ft
Est. Value
About This Home
This home is located at 22 Sycamore St, West Hempstead, NY 11552 and is currently estimated at $718,393, approximately $473 per square foot. 22 Sycamore St is a home located in Nassau County with nearby schools including Chestnut Street School, West Hempstead Secondary School, and Hebrew Academy of Nassau County (HANC).
Ownership History
Date
Name
Owned For
Owner Type
Purchase Details
Closed on
Dec 27, 2010
Sold by
Cherney Adam
Bought by
Morris Althea
Current Estimated Value
Home Financials for this Owner
Home Financials are based on the most recent Mortgage that was taken out on this home.
Original Mortgage
$299,081
Outstanding Balance
$203,611
Interest Rate
4.75%
Mortgage Type
FHA
Estimated Equity
$514,782
Purchase Details
Closed on
Aug 24, 2005
Sold by
Wilson Holly
Bought by
Cherney Adam
Create a Home Valuation Report for This Property
The Home Valuation Report is an in-depth analysis detailing your home's value as well as a comparison with similar homes in the area
Home Values in the Area
Average Home Value in this Area
Purchase History
| Date | Buyer | Sale Price | Title Company |
|---|---|---|---|
| Morris Althea | $325,000 | -- | |
| Cherney Adam | $425,000 | -- |
Source: Public Records
Mortgage History
| Date | Status | Borrower | Loan Amount |
|---|---|---|---|
| Open | Morris Althea | $299,081 |
Source: Public Records
Tax History Compared to Growth
Tax History
| Year | Tax Paid | Tax Assessment Tax Assessment Total Assessment is a certain percentage of the fair market value that is determined by local assessors to be the total taxable value of land and additions on the property. | Land | Improvement |
|---|---|---|---|---|
| 2025 | $11,921 | $449 | $195 | $254 |
| 2024 | $3,745 | $436 | $189 | $247 |
| 2023 | $10,096 | $475 | $215 | $260 |
| 2022 | $10,096 | $449 | $195 | $254 |
| 2021 | $11,012 | $472 | $205 | $267 |
| 2020 | $8,607 | $455 | $454 | $1 |
| 2019 | $7,096 | $488 | $461 | $27 |
| 2018 | $7,144 | $520 | $0 | $0 |
| 2017 | $4,554 | $553 | $464 | $89 |
| 2016 | $7,315 | $585 | $442 | $143 |
| 2015 | $2,878 | $618 | $376 | $242 |
| 2014 | $2,878 | $618 | $376 | $242 |
| 2013 | $2,834 | $650 | $395 | $255 |
Source: Public Records
Map
Nearby Homes