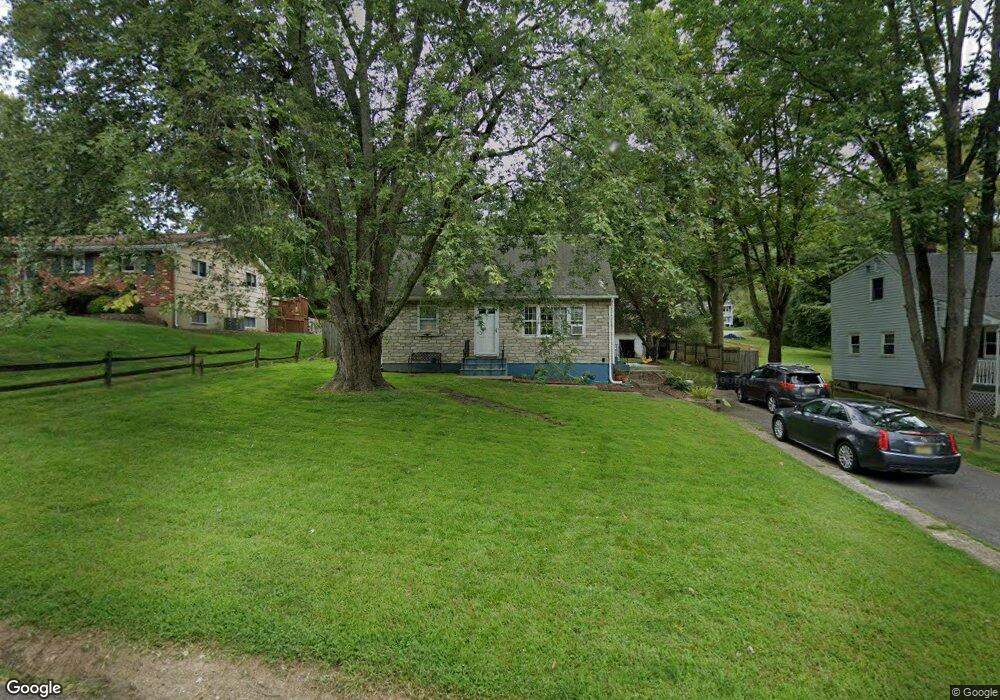
22 Sylvan Rd High Bridge, NJ 08829
Estimated Value: $345,000 - $566,000
3
Beds
2
Baths
1,344
Sq Ft
$300/Sq Ft
Est. Value
About This Home
This home is located at 22 Sylvan Rd, High Bridge, NJ 08829 and is currently estimated at $402,849, approximately $299 per square foot. 22 Sylvan Rd is a home located in Hunterdon County with nearby schools including High Bridge Elementary School, High Bridge Middle School, and Voorhees High School.
Ownership History
Date
Name
Owned For
Owner Type
Purchase Details
Closed on
Aug 23, 2005
Sold by
Brown Jeffrey S and Brown Cassandra L
Bought by
Melendez Felipe and Santiago Magda
Current Estimated Value
Home Financials for this Owner
Home Financials are based on the most recent Mortgage that was taken out on this home.
Original Mortgage
$317,588
Outstanding Balance
$168,225
Interest Rate
5.79%
Mortgage Type
FHA
Estimated Equity
$234,624
Purchase Details
Closed on
Jun 28, 1999
Sold by
Vesey Joseph P
Bought by
Brown Jeffrey S and Brown Cassandra L
Home Financials for this Owner
Home Financials are based on the most recent Mortgage that was taken out on this home.
Original Mortgage
$169,050
Interest Rate
7.19%
Mortgage Type
FHA
Purchase Details
Closed on
Oct 26, 1990
Sold by
George Paul L and George Virginia R
Bought by
Vesey Joseph P and Eleanor Weil
Create a Home Valuation Report for This Property
The Home Valuation Report is an in-depth analysis detailing your home's value as well as a comparison with similar homes in the area
Home Values in the Area
Average Home Value in this Area
Purchase History
| Date | Buyer | Sale Price | Title Company |
|---|---|---|---|
| Melendez Felipe | $337,500 | Fidelity Natl Title Ins Co | |
| Brown Jeffrey S | $170,500 | -- | |
| Vesey Joseph P | $145,500 | -- |
Source: Public Records
Mortgage History
| Date | Status | Borrower | Loan Amount |
|---|---|---|---|
| Open | Melendez Felipe | $317,588 | |
| Previous Owner | Brown Jeffrey S | $169,050 |
Source: Public Records
Tax History Compared to Growth
Tax History
| Year | Tax Paid | Tax Assessment Tax Assessment Total Assessment is a certain percentage of the fair market value that is determined by local assessors to be the total taxable value of land and additions on the property. | Land | Improvement |
|---|---|---|---|---|
| 2025 | $12,573 | $349,800 | $181,500 | $168,300 |
| 2024 | $11,320 | $385,200 | $142,900 | $242,300 |
| 2023 | $11,320 | $286,300 | $107,200 | $179,100 |
| 2022 | $10,284 | $241,700 | $94,600 | $147,100 |
| 2021 | $9,997 | $241,400 | $94,600 | $146,800 |
| 2020 | $9,889 | $241,200 | $94,600 | $146,600 |
| 2019 | $9,997 | $242,000 | $94,600 | $147,400 |
| 2018 | $9,523 | $240,300 | $92,000 | $148,300 |
| 2017 | $9,728 | $252,400 | $101,500 | $150,900 |
| 2016 | $9,614 | $252,400 | $101,500 | $150,900 |
| 2015 | $9,354 | $252,400 | $101,500 | $150,900 |
| 2014 | $9,433 | $275,100 | $137,700 | $137,400 |
Source: Public Records
Map
Nearby Homes