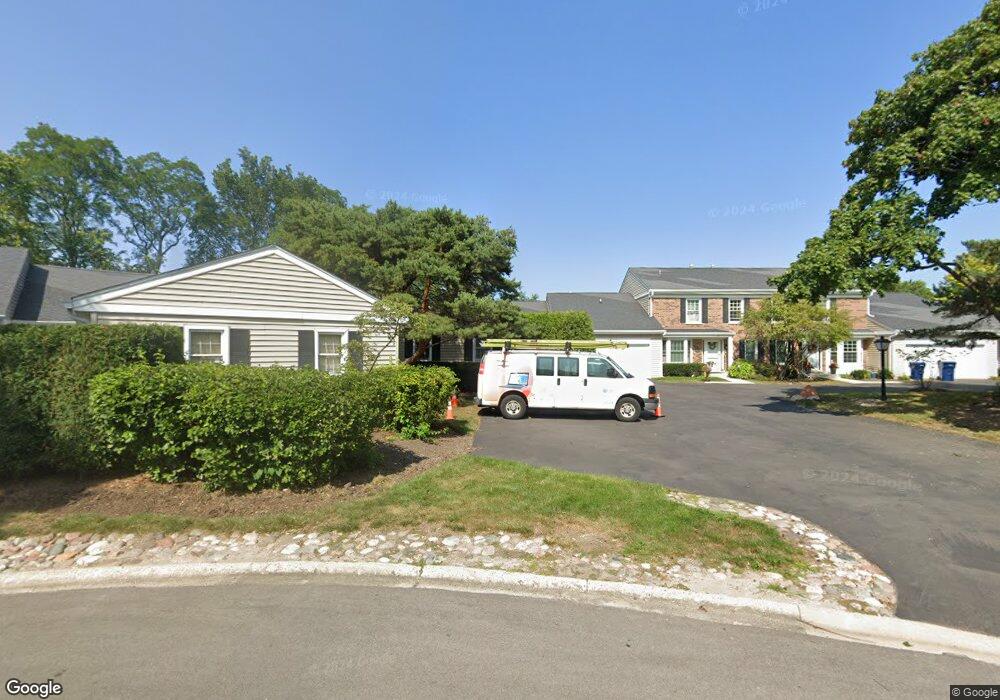
22 The Court of Greenway Unit 164 Northbrook, IL 60062
Estimated Value: $421,913 - $505,000
2
Beds
2
Baths
1,400
Sq Ft
$334/Sq Ft
Est. Value
About This Home
This home is located at 22 The Court of Greenway Unit 164, Northbrook, IL 60062 and is currently estimated at $468,228, approximately $334 per square foot. 22 The Court of Greenway Unit 164 is a home located in Cook County with nearby schools including Hickory Point Elementary School, Shabonee Elementary School, and Wood Oaks Jr High School.
Ownership History
Date
Name
Owned For
Owner Type
Purchase Details
Closed on
Oct 27, 2023
Sold by
Chase Diane K
Bought by
Diane K Chase Living Trust and Chase
Current Estimated Value
Purchase Details
Closed on
Oct 26, 2017
Sold by
Hyde William and Hyde Carol A
Bought by
Chase Kenneth and Chase Diane
Purchase Details
Closed on
May 15, 2009
Sold by
Wheeler Thomas C and Wheeler Robert M
Bought by
Hyde William and Hyde Carol A
Home Financials for this Owner
Home Financials are based on the most recent Mortgage that was taken out on this home.
Original Mortgage
$150,000
Interest Rate
4.84%
Mortgage Type
Purchase Money Mortgage
Purchase Details
Closed on
Mar 1, 2005
Sold by
Wheeler Harry K and Wheeler Etta Jean
Bought by
Harry K Wheeler Trust
Create a Home Valuation Report for This Property
The Home Valuation Report is an in-depth analysis detailing your home's value as well as a comparison with similar homes in the area
Home Values in the Area
Average Home Value in this Area
Purchase History
| Date | Buyer | Sale Price | Title Company |
|---|---|---|---|
| Diane K Chase Living Trust | -- | None Listed On Document | |
| Chase Kenneth | $342,500 | Chicago Title Insurance | |
| Hyde William | $330,000 | Attorneys Title Guaranty Fun | |
| Harry K Wheeler Trust | -- | -- |
Source: Public Records
Mortgage History
| Date | Status | Borrower | Loan Amount |
|---|---|---|---|
| Previous Owner | Hyde William | $150,000 |
Source: Public Records
Tax History Compared to Growth
Tax History
| Year | Tax Paid | Tax Assessment Tax Assessment Total Assessment is a certain percentage of the fair market value that is determined by local assessors to be the total taxable value of land and additions on the property. | Land | Improvement |
|---|---|---|---|---|
| 2024 | $5,706 | $30,430 | $7,199 | $23,231 |
| 2023 | $5,469 | $30,430 | $7,199 | $23,231 |
| 2022 | $5,469 | $30,430 | $7,199 | $23,231 |
| 2021 | $6,199 | $30,482 | $6,708 | $23,774 |
| 2020 | $6,209 | $30,482 | $6,708 | $23,774 |
| 2019 | $6,050 | $33,477 | $6,708 | $26,769 |
| 2018 | $4,643 | $25,446 | $5,808 | $19,638 |
| 2017 | $4,538 | $25,446 | $5,808 | $19,638 |
| 2016 | $4,650 | $25,446 | $5,808 | $19,638 |
| 2015 | $5,143 | $23,692 | $4,826 | $18,866 |
| 2014 | $5,031 | $23,692 | $4,826 | $18,866 |
| 2013 | $5,312 | $25,577 | $4,826 | $20,751 |
Source: Public Records
Map
Nearby Homes
- 47 The Court of Greenway Unit 121
- 3 The Court of Harborside Unit 111
- 8 The Court of Charlwood
- 9 the Court of Lagoon View
- 3110 Pheasant Creek Dr Unit 101
- 3110 Pheasant Creek Dr Unit 206
- 3110 Pheasant Creek Dr Unit A
- 1331 Adirondack Dr Unit 1
- 1012 Sussex Dr Unit 1012
- 1039 Sussex Dr Unit 1039
- 3070 Pheasant Creek Dr Unit 201
- 3050 Pheasant Creek Dr Unit 301
- 1400 Kingsport Ct
- 3030 Pheasant Creek Dr Unit 207
- 3030 Pheasant Creek Dr Unit 102
- 1415 Chartres Dr Unit 1F
- 1421 Chartres Dr
- 3622 Dauphine Ave
- 2814 Crimson Ct
- 1696 Highland Ave
- 21 The Court of Greenway Unit 174
- 21 The Court of Greenway Unit 21
- 23 The Court of Greenway Unit 162
- 20 The Court of Greenway Unit 173
- 20 The Court of Greenway Unit 20
- 20 The Court of Greenway Unit 20
- 24 The Court of Greenway Unit 163
- 24 The Court of Greenway Unit 24
- 24 The Court of Greenway Unit 24
- 10 The Court of Greenway Unit 1104
- 25 The Court of Greenway Unit 161
- 19 The Court of Greenway Unit 172
- 26 The Court of Greenway Unit 151
- 26 The Court of Greenway Unit 26
- 26 The Court of Greenway Unit 26
- 15 The Court of Greenway Unit 183
- 17 The Court of Greenway Unit 181
- 9 The Court of Greenway Unit 1102
- 18 The Court of Greenway Unit 171
- 18 The Court of Greenway