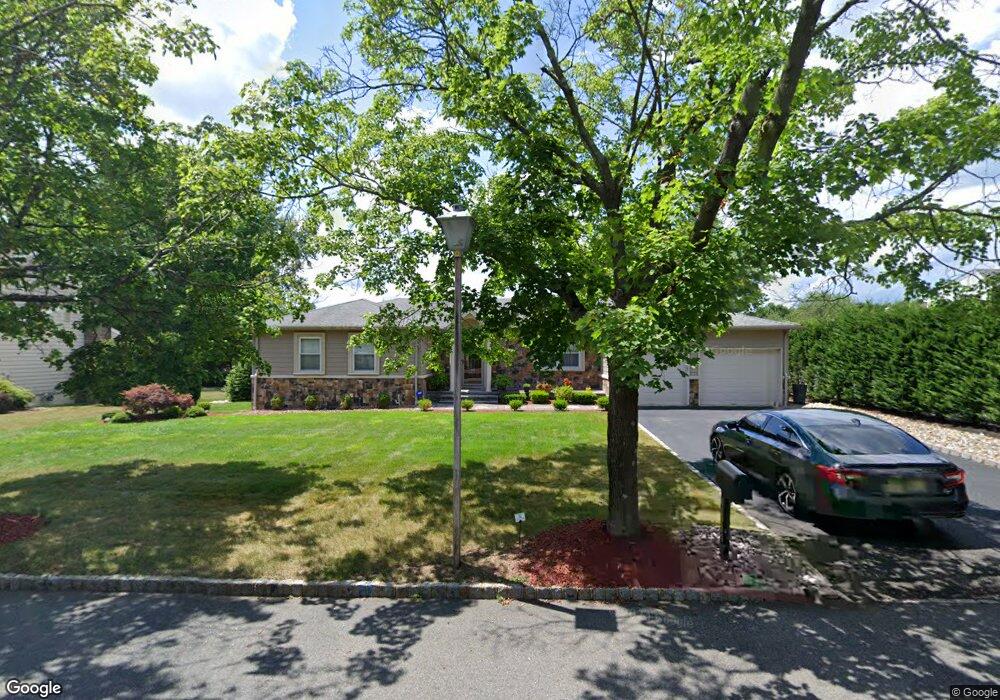
22 Tower Dr East Hanover, NJ 07936
Estimated Value: $799,495 - $934,000
--
Bed
--
Bath
1,786
Sq Ft
$485/Sq Ft
Est. Value
About This Home
This home is located at 22 Tower Dr, East Hanover, NJ 07936 and is currently estimated at $866,374, approximately $485 per square foot. 22 Tower Dr is a home located in Morris County with nearby schools including Frank J. Smith Elementary School, Central Elementary School, and East Hanover Middle School.
Ownership History
Date
Name
Owned For
Owner Type
Purchase Details
Closed on
Nov 14, 2009
Sold by
Stone Alex
Bought by
Giuca Giovanni and Giuca Andreia
Current Estimated Value
Home Financials for this Owner
Home Financials are based on the most recent Mortgage that was taken out on this home.
Original Mortgage
$404,000
Outstanding Balance
$263,931
Interest Rate
5.01%
Mortgage Type
New Conventional
Estimated Equity
$602,443
Purchase Details
Closed on
May 11, 1999
Sold by
Stone Sol
Bought by
Stone Anne
Create a Home Valuation Report for This Property
The Home Valuation Report is an in-depth analysis detailing your home's value as well as a comparison with similar homes in the area
Home Values in the Area
Average Home Value in this Area
Purchase History
| Date | Buyer | Sale Price | Title Company |
|---|---|---|---|
| Giuca Giovanni | $505,000 | None Available | |
| Stone Anne | -- | -- |
Source: Public Records
Mortgage History
| Date | Status | Borrower | Loan Amount |
|---|---|---|---|
| Open | Giuca Giovanni | $404,000 |
Source: Public Records
Tax History Compared to Growth
Tax History
| Year | Tax Paid | Tax Assessment Tax Assessment Total Assessment is a certain percentage of the fair market value that is determined by local assessors to be the total taxable value of land and additions on the property. | Land | Improvement |
|---|---|---|---|---|
| 2025 | $9,414 | $362,900 | $183,800 | $179,100 |
| 2024 | $9,054 | $362,900 | $183,800 | $179,100 |
| 2023 | $9,054 | $362,900 | $183,800 | $179,100 |
| 2022 | $8,848 | $362,900 | $183,800 | $179,100 |
| 2021 | $8,848 | $362,900 | $183,800 | $179,100 |
| 2020 | $8,673 | $362,900 | $183,800 | $179,100 |
| 2019 | $8,514 | $362,900 | $183,800 | $179,100 |
| 2018 | $8,256 | $362,900 | $183,800 | $179,100 |
| 2017 | $7,987 | $362,900 | $183,800 | $179,100 |
| 2016 | $7,879 | $362,900 | $183,800 | $179,100 |
| 2015 | $7,766 | $362,900 | $183,800 | $179,100 |
| 2014 | $7,599 | $355,100 | $183,800 | $171,300 |
Source: Public Records
Map
Nearby Homes
- 32 Ridge Dr
- 71 Tiffany Dr
- 22 Valley View Dr
- 250 Ridgedale Ave Unit 8
- 50 River Rd
- 250 S Ridgedale Ave Unit 4
- 243 Ridgedale Ave
- 16 Claire Ct
- 6 Hanover Rd
- 3 Gregory Dr
- 29 Beach St
- 38 Park St Unit 8F
- 38 Park St Unit F
- 60 Baker Rd
- 14 Kenneth Ct
- 4 Justin Dr
- 15 Park St
- 46 Eastwood Terrace Unit 55
- 7 Eastwood Terrace
- 9 1st St