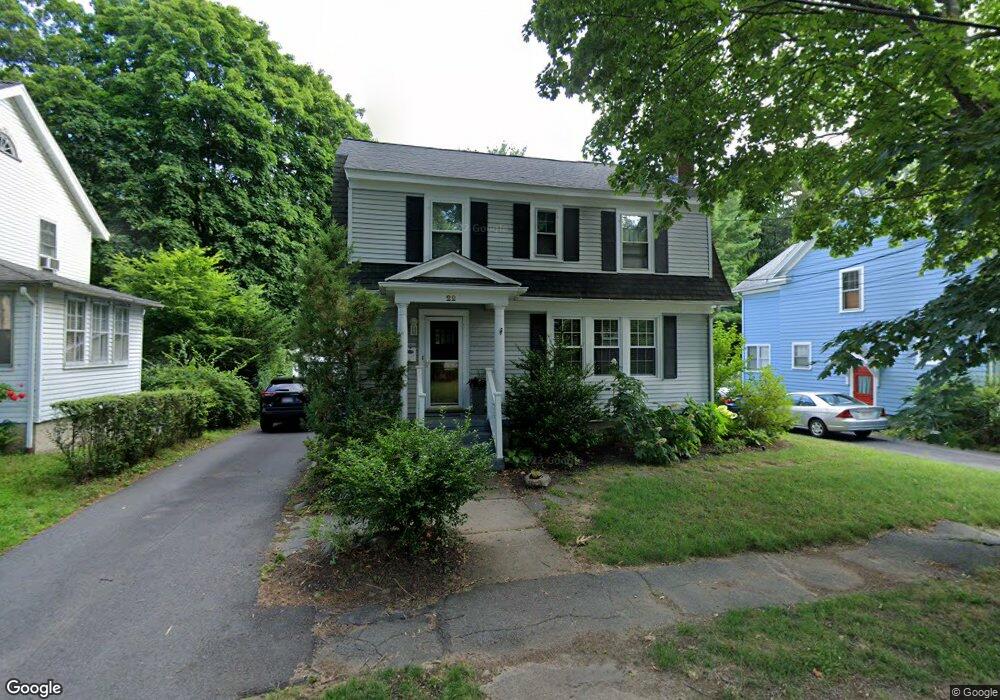
22 Tucker St Natick, MA 01760
Estimated Value: $797,000 - $1,259,000
3
Beds
2
Baths
1,638
Sq Ft
$586/Sq Ft
Est. Value
About This Home
This home is located at 22 Tucker St, Natick, MA 01760 and is currently estimated at $959,965, approximately $586 per square foot. 22 Tucker St is a home located in Middlesex County with nearby schools including Natick High School, Johnson Elementary School, and J F Kennedy Middle School.
Ownership History
Date
Name
Owned For
Owner Type
Purchase Details
Closed on
Jul 9, 2018
Sold by
Doremus Christopher J and Collins Mary J
Bought by
Doremus Christopher J and Collins Mary J
Current Estimated Value
Purchase Details
Closed on
May 28, 2002
Sold by
Miller Wallace R and Miller Louise R
Bought by
Doremus Christopher and Collins-Doremus Maryjo
Home Financials for this Owner
Home Financials are based on the most recent Mortgage that was taken out on this home.
Original Mortgage
$343,920
Interest Rate
7.01%
Mortgage Type
Purchase Money Mortgage
Create a Home Valuation Report for This Property
The Home Valuation Report is an in-depth analysis detailing your home's value as well as a comparison with similar homes in the area
Home Values in the Area
Average Home Value in this Area
Purchase History
| Date | Buyer | Sale Price | Title Company |
|---|---|---|---|
| Doremus Christopher J | -- | -- | |
| Doremus Christopher | $429,900 | -- |
Source: Public Records
Mortgage History
| Date | Status | Borrower | Loan Amount |
|---|---|---|---|
| Previous Owner | Doremus Christopher | $343,920 |
Source: Public Records
Tax History Compared to Growth
Tax History
| Year | Tax Paid | Tax Assessment Tax Assessment Total Assessment is a certain percentage of the fair market value that is determined by local assessors to be the total taxable value of land and additions on the property. | Land | Improvement |
|---|---|---|---|---|
| 2025 | $8,379 | $700,600 | $439,000 | $261,600 |
| 2024 | $8,098 | $660,500 | $414,600 | $245,900 |
| 2023 | $7,839 | $620,200 | $390,200 | $230,000 |
| 2022 | $7,550 | $566,000 | $356,100 | $209,900 |
| 2021 | $7,266 | $533,900 | $336,600 | $197,300 |
| 2020 | $6,868 | $504,600 | $307,300 | $197,300 |
| 2019 | $6,413 | $504,600 | $307,300 | $197,300 |
| 2018 | $6,513 | $499,100 | $292,700 | $206,400 |
| 2017 | $6,143 | $455,400 | $258,500 | $196,900 |
| 2016 | $5,953 | $438,700 | $243,600 | $195,100 |
| 2015 | $5,846 | $423,000 | $243,600 | $179,400 |
Source: Public Records
Map
Nearby Homes