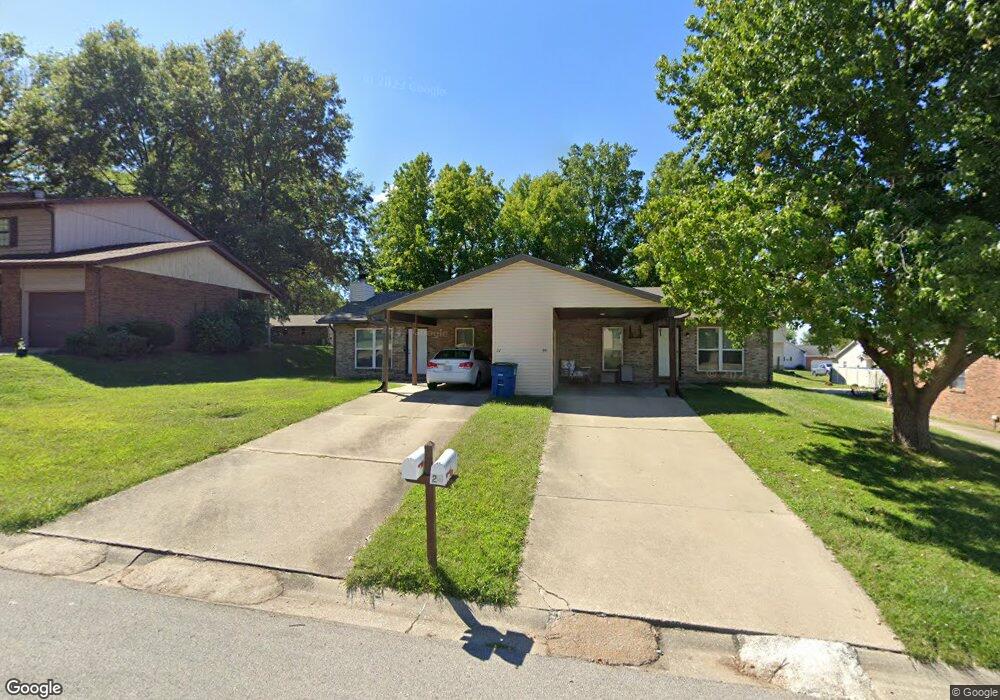
22 Twin Oaks Dr Belleville, IL 62221
Estimated Value: $185,000 - $234,852
4
Beds
--
Bath
2,040
Sq Ft
$102/Sq Ft
Est. Value
About This Home
This home is located at 22 Twin Oaks Dr, Belleville, IL 62221 and is currently estimated at $208,713, approximately $102 per square foot. 22 Twin Oaks Dr is a home located in St. Clair County with nearby schools including Shiloh Elementary School, Shiloh Middle School, and O'Fallon Township High School.
Ownership History
Date
Name
Owned For
Owner Type
Purchase Details
Closed on
Oct 23, 2013
Sold by
Fannie Mae
Bought by
Scagliarini Tommy Joe and Scagliarini Denise C
Current Estimated Value
Home Financials for this Owner
Home Financials are based on the most recent Mortgage that was taken out on this home.
Original Mortgage
$84,375
Outstanding Balance
$63,622
Interest Rate
4.59%
Mortgage Type
New Conventional
Estimated Equity
$145,091
Purchase Details
Closed on
Mar 4, 2013
Sold by
Carl Christopher
Bought by
Federal National Mortgage Association
Purchase Details
Closed on
Jul 12, 2010
Sold by
Carl Jason
Bought by
Carl Christopher
Purchase Details
Closed on
Dec 26, 2003
Sold by
Carmody James M
Bought by
Carl William
Home Financials for this Owner
Home Financials are based on the most recent Mortgage that was taken out on this home.
Original Mortgage
$84,000
Interest Rate
5.84%
Mortgage Type
Purchase Money Mortgage
Create a Home Valuation Report for This Property
The Home Valuation Report is an in-depth analysis detailing your home's value as well as a comparison with similar homes in the area
Home Values in the Area
Average Home Value in this Area
Purchase History
| Date | Buyer | Sale Price | Title Company |
|---|---|---|---|
| Scagliarini Tommy Joe | $112,500 | Fatic | |
| Federal National Mortgage Association | -- | None Available | |
| Carl Christopher | -- | None Available | |
| Carl William | $105,000 | First American Title Midwest |
Source: Public Records
Mortgage History
| Date | Status | Borrower | Loan Amount |
|---|---|---|---|
| Open | Scagliarini Tommy Joe | $84,375 | |
| Previous Owner | Carl William | $84,000 |
Source: Public Records
Tax History Compared to Growth
Tax History
| Year | Tax Paid | Tax Assessment Tax Assessment Total Assessment is a certain percentage of the fair market value that is determined by local assessors to be the total taxable value of land and additions on the property. | Land | Improvement |
|---|---|---|---|---|
| 2024 | $4,575 | $61,704 | $9,261 | $52,443 |
| 2023 | $3,559 | $46,931 | $8,989 | $37,942 |
| 2022 | $3,418 | $43,714 | $8,373 | $35,341 |
| 2021 | $3,194 | $41,108 | $7,874 | $33,234 |
| 2020 | $3,296 | $38,797 | $7,431 | $31,366 |
| 2019 | $3,351 | $40,152 | $7,718 | $32,434 |
| 2018 | $3,293 | $39,006 | $7,498 | $31,508 |
| 2017 | $1,609 | $37,174 | $7,146 | $30,028 |
| 2016 | $3,173 | $36,467 | $7,010 | $29,457 |
| 2014 | $1,820 | $45,368 | $7,947 | $37,421 |
| 2013 | $5,527 | $45,979 | $8,054 | $37,925 |
Source: Public Records
Map
Nearby Homes
- 101 Montrose Ct
- 409 Sage Dr
- 3567 Sky Hawk Dr
- 3716 Osprey Ct
- 3533 Capri Ln
- 3830 Breezy Hill
- 3700 Osprey Ct
- 433 Briarberry Dr
- 3536 Harbor Way
- 414 Grand Reserve
- 3719 Thicket Dr
- 3714 Thicket Dr
- 3745 Thicket Dr
- 505 Master Ct
- 3740 Golfview Cir
- xxxx Christine Dr
- xxxx Chippewa Dr
- 31 Ramona Dr
- Brady Plan at Indian Springs - Indian Spring
- Winchester B Plan at Indian Springs - Indian Spring
- 24 Twin Oaks Dr
- 18 Twin Oaks Dr
- 26 Twin Oaks Dr Unit 28
- 11 Acorn Lake Dr
- 5 Acorn Lake Dr
- 16 Twin Oaks Dr
- 19 Twin Oaks Dr
- 14 Twin Oaks Dr
- 14 Twin Oaks Dr
- 34 Twin Oaks Dr
- 13 Acorn Lake Dr
- 21 Twin Oaks Dr
- 17 Twin Oaks Dr
- 1 Acorn Lake Dr
- 13 Twin Oaks Dr
- 25 Twin Oaks Dr
- 15 Twin Oaks Dr
- 27 Twin Oaks Dr
- 12 Twin Oaks Dr
- 17 Acorn Lake Dr