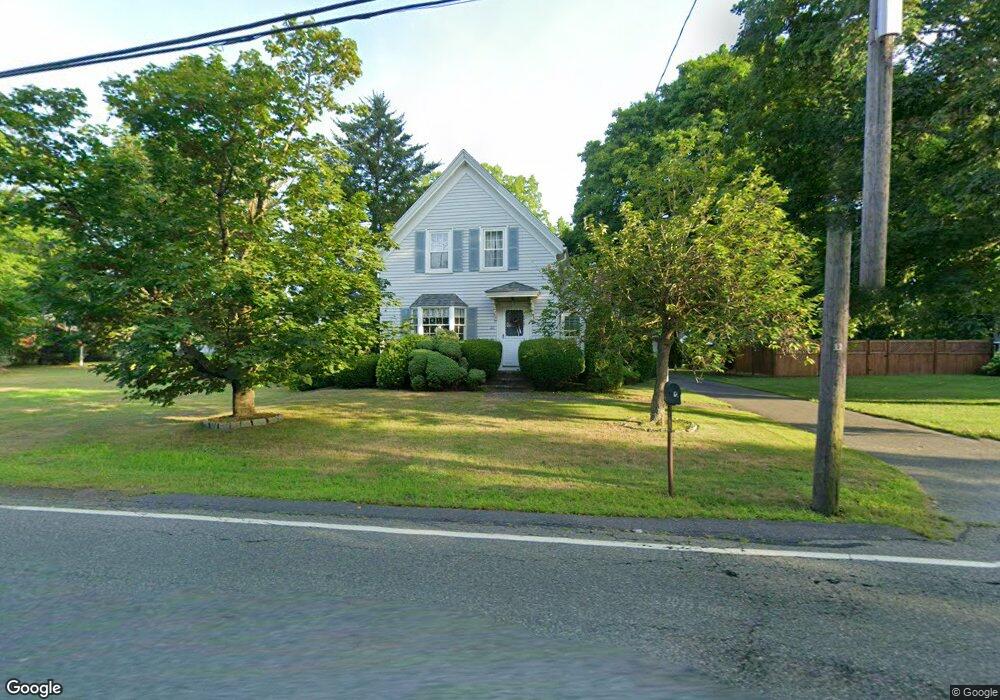
22 Union St West Bridgewater, MA 02379
Estimated Value: $509,198 - $587,000
3
Beds
1
Bath
1,428
Sq Ft
$376/Sq Ft
Est. Value
About This Home
This home is located at 22 Union St, West Bridgewater, MA 02379 and is currently estimated at $536,800, approximately $375 per square foot. 22 Union St is a home located in Plymouth County with nearby schools including Spring Street Elementary School, Howard Elementary School, and Rose L. MacDonald Elementary School.
Ownership History
Date
Name
Owned For
Owner Type
Purchase Details
Closed on
Mar 22, 2016
Sold by
Benson S Erick
Bought by
Benson Irt
Current Estimated Value
Purchase Details
Closed on
Jun 2, 2014
Sold by
Benson James E and Packard Cheryl A
Bought by
Benson S E
Purchase Details
Closed on
Aug 3, 2012
Sold by
Benson S E and Benson Sven E
Bought by
Benson Irt and Benson James E
Create a Home Valuation Report for This Property
The Home Valuation Report is an in-depth analysis detailing your home's value as well as a comparison with similar homes in the area
Home Values in the Area
Average Home Value in this Area
Purchase History
| Date | Buyer | Sale Price | Title Company |
|---|---|---|---|
| Benson Irt | -- | -- | |
| Benson Irt | -- | -- | |
| Benson S E | -- | -- | |
| Benson S E | -- | -- | |
| Benson James E | -- | -- | |
| Benson James E | -- | -- | |
| Benson Irt | -- | -- |
Source: Public Records
Tax History Compared to Growth
Tax History
| Year | Tax Paid | Tax Assessment Tax Assessment Total Assessment is a certain percentage of the fair market value that is determined by local assessors to be the total taxable value of land and additions on the property. | Land | Improvement |
|---|---|---|---|---|
| 2025 | $5,990 | $438,200 | $226,700 | $211,500 |
| 2024 | $5,686 | $401,300 | $206,800 | $194,500 |
| 2023 | $5,412 | $352,100 | $185,000 | $167,100 |
| 2022 | $5,035 | $310,400 | $171,000 | $139,400 |
| 2021 | $4,946 | $296,000 | $163,100 | $132,900 |
| 2020 | $4,846 | $296,000 | $163,100 | $132,900 |
| 2019 | $4,893 | $296,000 | $163,100 | $132,900 |
| 2018 | $4,646 | $271,700 | $149,200 | $122,500 |
| 2017 | $4,535 | $255,800 | $139,200 | $116,600 |
| 2016 | $4,498 | $249,900 | $133,300 | $116,600 |
| 2015 | $4,451 | $249,900 | $133,300 | $116,600 |
| 2014 | $3,953 | $239,700 | $125,700 | $114,000 |
Source: Public Records
Map
Nearby Homes