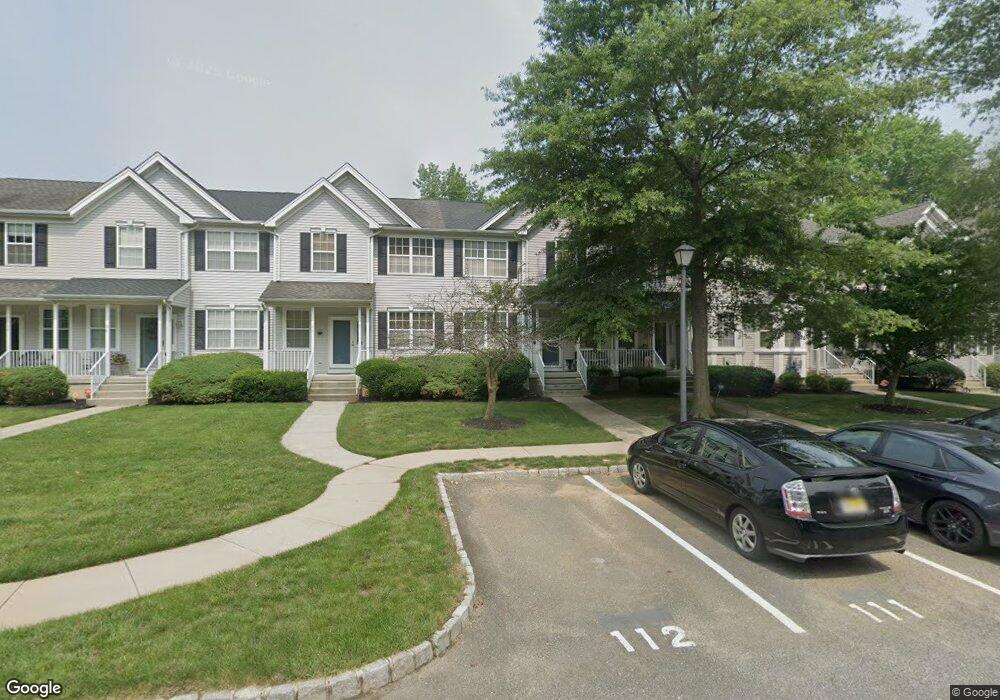
22 Uxbridge Dr Trenton, NJ 08691
Estimated Value: $504,816 - $612,000
--
Bed
--
Bath
1,556
Sq Ft
$362/Sq Ft
Est. Value
About This Home
This home is located at 22 Uxbridge Dr, Trenton, NJ 08691 and is currently estimated at $562,954, approximately $361 per square foot. 22 Uxbridge Dr is a home located in Mercer County with nearby schools including Sharon Elementary School, Pond Road Middle School, and Robbinsville High School.
Ownership History
Date
Name
Owned For
Owner Type
Purchase Details
Closed on
Jul 11, 2000
Sold by
Sharbell Washington Inc
Bought by
Mitchell Diane Ack
Current Estimated Value
Home Financials for this Owner
Home Financials are based on the most recent Mortgage that was taken out on this home.
Original Mortgage
$122,500
Outstanding Balance
$43,679
Interest Rate
8.18%
Mortgage Type
Purchase Money Mortgage
Estimated Equity
$519,275
Create a Home Valuation Report for This Property
The Home Valuation Report is an in-depth analysis detailing your home's value as well as a comparison with similar homes in the area
Home Values in the Area
Average Home Value in this Area
Purchase History
| Date | Buyer | Sale Price | Title Company |
|---|---|---|---|
| Mitchell Diane Ack | $153,182 | -- | |
| -- | $153,200 | -- |
Source: Public Records
Mortgage History
| Date | Status | Borrower | Loan Amount |
|---|---|---|---|
| Open | -- | $122,500 |
Source: Public Records
Tax History Compared to Growth
Tax History
| Year | Tax Paid | Tax Assessment Tax Assessment Total Assessment is a certain percentage of the fair market value that is determined by local assessors to be the total taxable value of land and additions on the property. | Land | Improvement |
|---|---|---|---|---|
| 2025 | $9,338 | $279,400 | $128,200 | $151,200 |
| 2024 | $8,714 | $279,400 | $128,200 | $151,200 |
| 2023 | $8,714 | $279,400 | $128,200 | $151,200 |
| 2022 | $8,376 | $279,400 | $128,200 | $151,200 |
| 2021 | $8,256 | $279,400 | $128,200 | $151,200 |
| 2020 | $8,259 | $279,400 | $128,200 | $151,200 |
| 2019 | $8,262 | $279,400 | $128,200 | $151,200 |
| 2018 | $8,209 | $279,400 | $128,200 | $151,200 |
| 2017 | $8,192 | $279,400 | $128,200 | $151,200 |
| 2016 | $8,117 | $279,400 | $128,200 | $151,200 |
| 2015 | $7,994 | $279,400 | $128,200 | $151,200 |
| 2014 | $8,022 | $279,400 | $128,200 | $151,200 |
Source: Public Records
Map
Nearby Homes