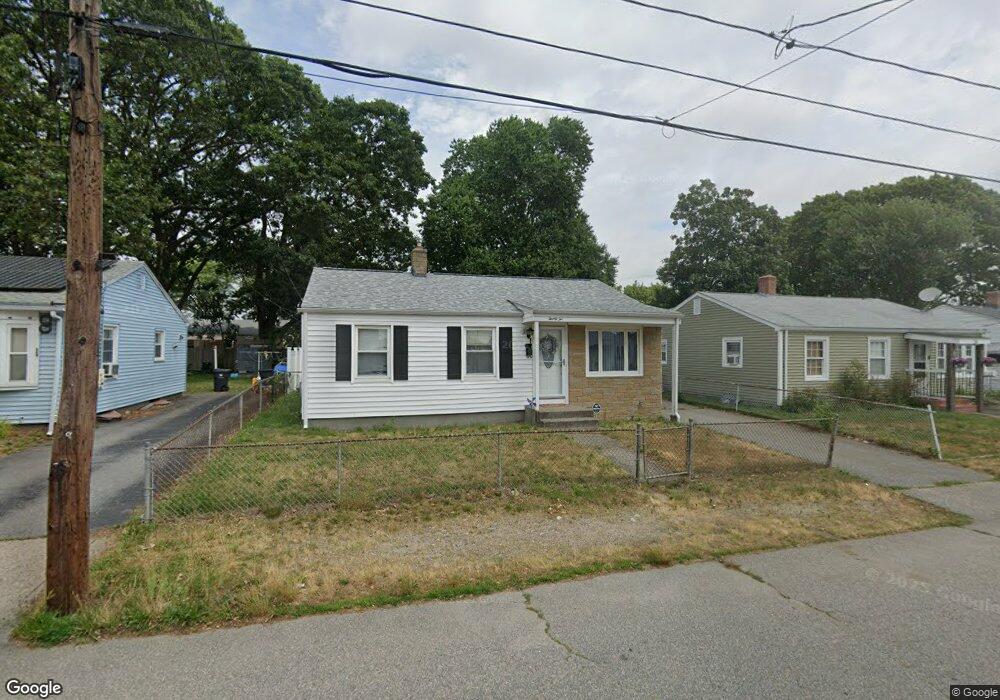
22 Vineyard St Pawtucket, RI 02860
Beverage Hill-The Plains NeighborhoodEstimated Value: $343,000 - $372,000
3
Beds
1
Bath
896
Sq Ft
$398/Sq Ft
Est. Value
About This Home
This home is located at 22 Vineyard St, Pawtucket, RI 02860 and is currently estimated at $356,819, approximately $398 per square foot. 22 Vineyard St is a home located in Providence County with nearby schools including International Charter School, Saint Teresa Catholic Elementary School, and Saint Raphael Academy.
Ownership History
Date
Name
Owned For
Owner Type
Purchase Details
Closed on
Jun 30, 2011
Sold by
Robinson Robert E and Robinson Constance B
Bought by
Robinson Christina
Current Estimated Value
Home Financials for this Owner
Home Financials are based on the most recent Mortgage that was taken out on this home.
Original Mortgage
$128,623
Outstanding Balance
$87,342
Interest Rate
4.62%
Mortgage Type
FHA
Estimated Equity
$269,477
Create a Home Valuation Report for This Property
The Home Valuation Report is an in-depth analysis detailing your home's value as well as a comparison with similar homes in the area
Home Values in the Area
Average Home Value in this Area
Purchase History
| Date | Buyer | Sale Price | Title Company |
|---|---|---|---|
| Robinson Christina | -- | -- |
Source: Public Records
Mortgage History
| Date | Status | Borrower | Loan Amount |
|---|---|---|---|
| Open | Robinson Christina | $128,623 | |
| Closed | Robinson Christina | $4,620 | |
| Previous Owner | Robinson Christina | $40,000 | |
| Previous Owner | Robinson Christina | $52,000 |
Source: Public Records
Tax History
| Year | Tax Paid | Tax Assessment Tax Assessment Total Assessment is a certain percentage of the fair market value that is determined by local assessors to be the total taxable value of land and additions on the property. | Land | Improvement |
|---|---|---|---|---|
| 2025 | $3,785 | $287,800 | $132,000 | $155,800 |
| 2024 | $3,551 | $287,800 | $132,000 | $155,800 |
| 2023 | $3,522 | $207,900 | $80,200 | $127,700 |
| 2022 | $3,447 | $207,900 | $80,200 | $127,700 |
| 2021 | $3,447 | $207,900 | $80,200 | $127,700 |
| 2020 | $3,223 | $154,300 | $60,700 | $93,600 |
| 2019 | $3,223 | $154,300 | $60,700 | $93,600 |
| 2018 | $3,106 | $154,300 | $60,700 | $93,600 |
| 2017 | $2,979 | $131,100 | $46,800 | $84,300 |
| 2016 | $2,870 | $131,100 | $46,800 | $84,300 |
| 2015 | $2,870 | $131,100 | $46,800 | $84,300 |
| 2014 | $2,753 | $119,400 | $46,800 | $72,600 |
Source: Public Records
Map
Nearby Homes
- 33 Dover St
- 11 Crane St
- 84 Farrell St
- 68 Maryland Ave
- 275 Columbus Ave
- 23 Fortin Ave
- 38 Ashburne St
- 40 Rosemere Rd
- 333 School St Unit 109
- 339 Beverage Hill Ave
- 71 Birchland Ave
- 70 Brewster St
- 100 Pond St
- 146 S Bend St
- 70 Manistee St
- 60 Nassau St
- 400 Newport Ave
- 359 Williston Way
- 66 State St
- 14 Jones Ave
Your Personal Tour Guide
Ask me questions while you tour the home.