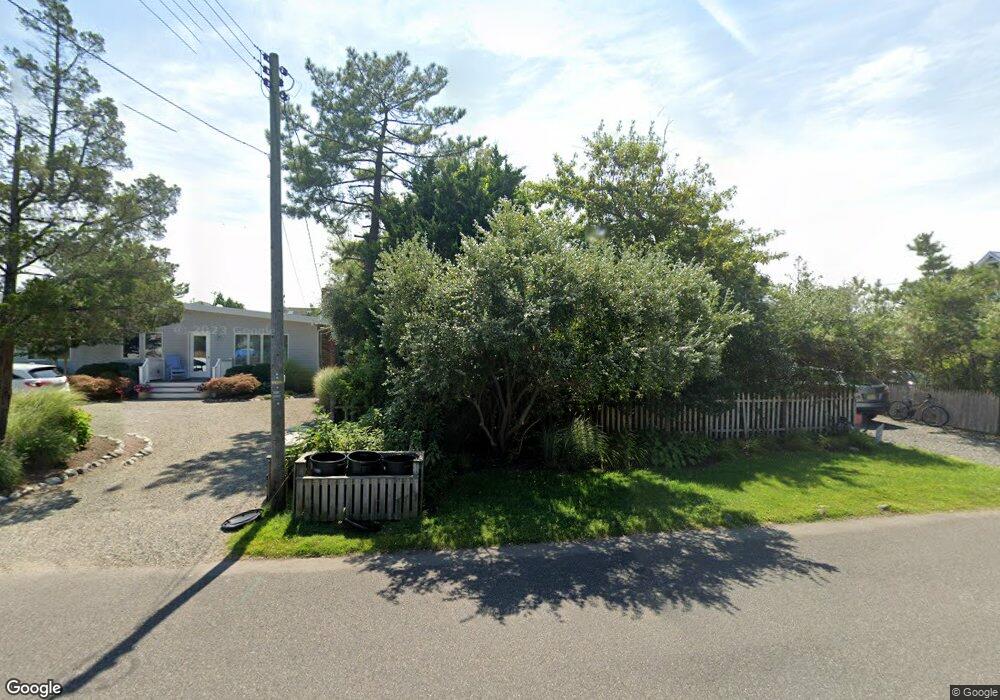
22 W 11th St Barnegat Light, NJ 08006
Long Beach Island NeighborhoodEstimated Value: $1,179,313 - $1,730,000
4
Beds
2
Baths
1,662
Sq Ft
$841/Sq Ft
Est. Value
About This Home
This home is located at 22 W 11th St, Barnegat Light, NJ 08006 and is currently estimated at $1,398,328, approximately $841 per square foot. 22 W 11th St is a home with nearby schools including Ethel A. Jacobsen Elementary School, Long Beach Island Grade School, and Southern Regional Middle School.
Ownership History
Date
Name
Owned For
Owner Type
Purchase Details
Closed on
Nov 8, 2013
Sold by
Isidore Christopher V and Isidore Adam P
Bought by
Isidore Christopher and Isidore Adam P
Current Estimated Value
Purchase Details
Closed on
Jun 18, 1996
Sold by
Mallaney William
Bought by
Isidore Nancy
Home Financials for this Owner
Home Financials are based on the most recent Mortgage that was taken out on this home.
Original Mortgage
$120,000
Interest Rate
7.9%
Create a Home Valuation Report for This Property
The Home Valuation Report is an in-depth analysis detailing your home's value as well as a comparison with similar homes in the area
Home Values in the Area
Average Home Value in this Area
Purchase History
| Date | Buyer | Sale Price | Title Company |
|---|---|---|---|
| Isidore Christopher | -- | None Available | |
| Isidore Nancy | $207,500 | -- |
Source: Public Records
Mortgage History
| Date | Status | Borrower | Loan Amount |
|---|---|---|---|
| Previous Owner | Isidore Nancy | $120,000 |
Source: Public Records
Tax History
| Year | Tax Paid | Tax Assessment Tax Assessment Total Assessment is a certain percentage of the fair market value that is determined by local assessors to be the total taxable value of land and additions on the property. | Land | Improvement |
|---|---|---|---|---|
| 2025 | $5,625 | $558,000 | $360,000 | $198,000 |
| 2024 | $4,972 | $558,000 | $360,000 | $198,000 |
Source: Public Records
Map
Nearby Homes
Your Personal Tour Guide
Ask me questions while you tour the home.