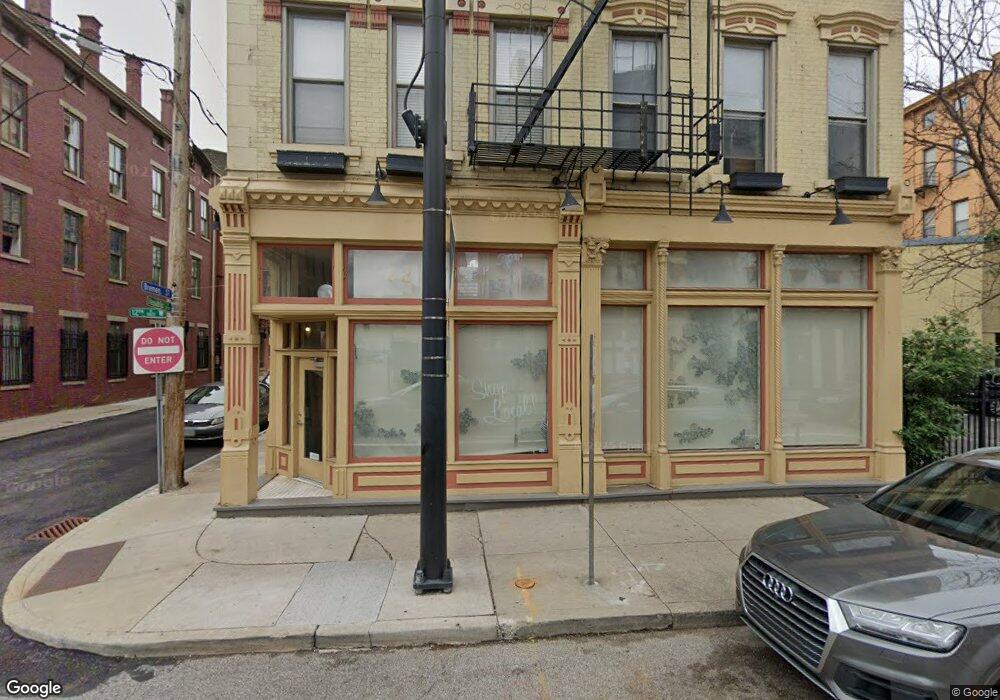
22 W 12th St Unit 102A Cincinnati, OH 45202
Over-The-Rhine NeighborhoodEstimated Value: $331,755 - $485,000
2
Beds
2
Baths
1,408
Sq Ft
$287/Sq Ft
Est. Value
About This Home
This home is located at 22 W 12th St Unit 102A, Cincinnati, OH 45202 and is currently estimated at $403,939, approximately $286 per square foot. 22 W 12th St Unit 102A is a home located in Hamilton County with nearby schools including Rothenberg Preparatory Academy, Robert A. Taft Information Technology High School, and Gilbert A. Dater High School.
Ownership History
Date
Name
Owned For
Owner Type
Purchase Details
Closed on
Jun 19, 2020
Sold by
Klauke Timothy
Bought by
Corbett Mary Jean
Current Estimated Value
Home Financials for this Owner
Home Financials are based on the most recent Mortgage that was taken out on this home.
Original Mortgage
$226,400
Outstanding Balance
$198,903
Interest Rate
3.2%
Mortgage Type
New Conventional
Estimated Equity
$205,036
Purchase Details
Closed on
Dec 8, 2014
Sold by
Klauke Jamie
Bought by
Klauke Timothy
Purchase Details
Closed on
Dec 21, 2007
Sold by
Bremen Lofts Property Holdings Llc
Bought by
Klauke Timothy and Klauke Jamie
Home Financials for this Owner
Home Financials are based on the most recent Mortgage that was taken out on this home.
Original Mortgage
$170,100
Interest Rate
6.13%
Mortgage Type
Purchase Money Mortgage
Create a Home Valuation Report for This Property
The Home Valuation Report is an in-depth analysis detailing your home's value as well as a comparison with similar homes in the area
Home Values in the Area
Average Home Value in this Area
Purchase History
| Date | Buyer | Sale Price | Title Company |
|---|---|---|---|
| Corbett Mary Jean | $283,000 | First Title Agency Inc | |
| Klauke Timothy | -- | Attorney | |
| Klauke Timothy | $189,000 | None Available |
Source: Public Records
Mortgage History
| Date | Status | Borrower | Loan Amount |
|---|---|---|---|
| Open | Corbett Mary Jean | $226,400 | |
| Previous Owner | Klauke Timothy | $170,100 |
Source: Public Records
Tax History
| Year | Tax Paid | Tax Assessment Tax Assessment Total Assessment is a certain percentage of the fair market value that is determined by local assessors to be the total taxable value of land and additions on the property. | Land | Improvement |
|---|---|---|---|---|
| 2025 | $6,374 | $100,037 | $10,500 | $89,537 |
| 2023 | $6,332 | $100,037 | $10,500 | $89,537 |
| 2022 | $6,964 | $99,050 | $10,647 | $88,403 |
| 2021 | $6,698 | $99,050 | $10,647 | $88,403 |
| 2020 | $7,093 | $99,050 | $10,647 | $88,403 |
| 2019 | $5,696 | $74,659 | $9,100 | $65,559 |
| 2018 | $5,700 | $74,659 | $9,100 | $65,559 |
| 2017 | $1,012 | $74,659 | $9,100 | $65,559 |
| 2016 | $1,147 | $73,427 | $10,101 | $63,326 |
| 2015 | $1,025 | $73,427 | $10,101 | $63,326 |
| 2014 | $1,031 | $73,427 | $10,101 | $63,326 |
| 2013 | $944 | $66,150 | $9,100 | $57,050 |
Source: Public Records
Map
Nearby Homes
- 22 W 12th St Unit 402A
- 22 W 12th St Unit 203A
- 22 W 12th St Unit 403A
- 22 W 12th St Unit 201A
- 22 W 12th St Unit 202A
- 22 W 12th St
- 22 W 12th St Unit 401A
- 20 W 12th St Unit 22
- 20 W 12th St Unit 102A
- 20 W 12th St Unit 201A22
- 20 W 12th St Unit 203A
- 20 W 12th St Unit 402A
- 20 W 12th St Unit 301A
- 20 W 12th St Unit 401A
- 20 W 12th St Unit 403A
- 20 W 12th St Unit 201A
- 20 W 12th St Unit 202A
- 1211 Republic St Unit 301C
- 1211 Republic St Unit 201C
- 1211 Republic St Unit 101C
Your Personal Tour Guide
Ask me questions while you tour the home.