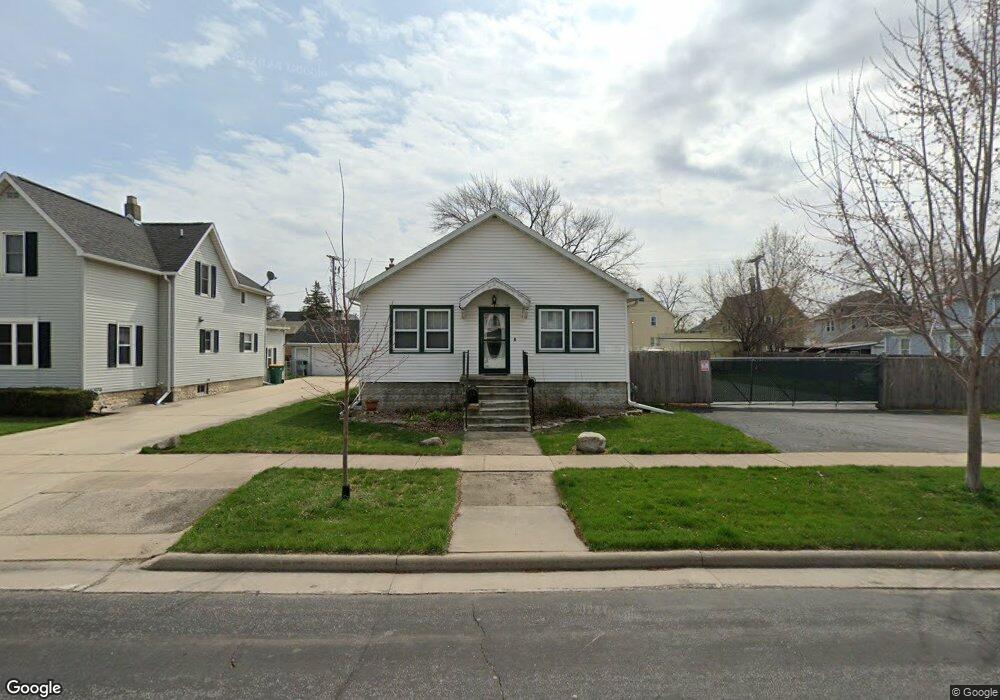
22 W 12th St Fond Du Lac, WI 54935
Estimated Value: $162,000 - $178,388
1
Bed
1
Bath
1,120
Sq Ft
$154/Sq Ft
Est. Value
About This Home
This home is located at 22 W 12th St, Fond Du Lac, WI 54935 and is currently estimated at $172,097, approximately $153 per square foot. 22 W 12th St is a home located in Fond du Lac County with nearby schools including Riverside Elementary School, Theisen Middle School, and Fond du Lac High School.
Ownership History
Date
Name
Owned For
Owner Type
Purchase Details
Closed on
Jun 1, 2023
Sold by
Magruder Kristin L
Bought by
Magruder Wade A
Current Estimated Value
Purchase Details
Closed on
May 29, 2009
Sold by
Gross Bruce L
Bought by
Magruder Wade and Magruder Kristin
Home Financials for this Owner
Home Financials are based on the most recent Mortgage that was taken out on this home.
Original Mortgage
$77,569
Interest Rate
4.84%
Mortgage Type
Purchase Money Mortgage
Create a Home Valuation Report for This Property
The Home Valuation Report is an in-depth analysis detailing your home's value as well as a comparison with similar homes in the area
Home Values in the Area
Average Home Value in this Area
Purchase History
| Date | Buyer | Sale Price | Title Company |
|---|---|---|---|
| Magruder Wade A | $109,600 | Zacherl, O'Malley & Endejan, S | |
| Magruder Wade | $79,000 | None Available |
Source: Public Records
Mortgage History
| Date | Status | Borrower | Loan Amount |
|---|---|---|---|
| Previous Owner | Magruder Wade | $77,569 |
Source: Public Records
Tax History Compared to Growth
Tax History
| Year | Tax Paid | Tax Assessment Tax Assessment Total Assessment is a certain percentage of the fair market value that is determined by local assessors to be the total taxable value of land and additions on the property. | Land | Improvement |
|---|---|---|---|---|
| 2024 | $2,160 | $92,400 | $25,400 | $67,000 |
| 2023 | $2,070 | $92,400 | $25,400 | $67,000 |
| 2022 | $1,975 | $92,400 | $25,400 | $67,000 |
| 2021 | $1,964 | $92,400 | $25,400 | $67,000 |
| 2020 | $2,007 | $92,400 | $25,400 | $67,000 |
| 2019 | $1,980 | $92,400 | $25,400 | $67,000 |
| 2018 | $1,988 | $86,200 | $25,400 | $60,800 |
| 2017 | $1,995 | $86,200 | $25,400 | $60,800 |
| 2016 | $1,989 | $86,200 | $25,400 | $60,800 |
| 2015 | $2,018 | $86,200 | $25,400 | $60,800 |
| 2014 | $1,959 | $86,200 | $25,400 | $60,800 |
| 2013 | $1,801 | $79,000 | $26,700 | $52,300 |
Source: Public Records
Map
Nearby Homes