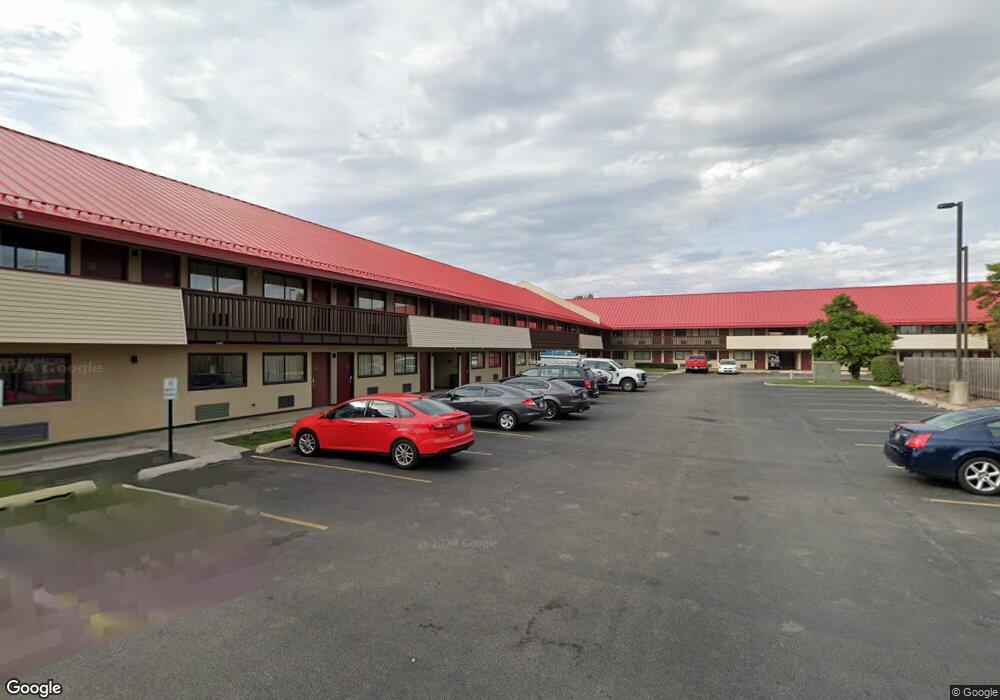
22 W Algonquin Rd Arlington Heights, IL 60005
1
Bed
1
Bath
450
Sq Ft
0.83
Acres
About This Home
This home is located at 22 W Algonquin Rd, Arlington Heights, IL 60005. 22 W Algonquin Rd is a home located in Cook County with nearby schools including Holmes Jr High School, Juliette Low Elementary School, and Rolling Meadows High School.
Ownership History
Date
Name
Owned For
Owner Type
Purchase Details
Closed on
Aug 28, 2019
Sold by
Four Apart Llc
Bought by
Ah Rri Hotel Llc
Home Financials for this Owner
Home Financials are based on the most recent Mortgage that was taken out on this home.
Original Mortgage
$5,000,000
Outstanding Balance
$4,174,404
Interest Rate
3.7%
Mortgage Type
Small Business Administration
Purchase Details
Closed on
Sep 24, 2012
Sold by
Rri Nc Llc
Bought by
Four Apart Llc
Home Financials for this Owner
Home Financials are based on the most recent Mortgage that was taken out on this home.
Original Mortgage
$1,837,500
Interest Rate
3.58%
Mortgage Type
Commercial
Purchase Details
Closed on
Aug 25, 2011
Sold by
R Roof Ii Llc
Bought by
Fmw Rri Nc Llc
Purchase Details
Closed on
Aug 29, 2007
Sold by
Rooftop Remainder Llc
Bought by
R & Roof Ii Llc
Home Financials for this Owner
Home Financials are based on the most recent Mortgage that was taken out on this home.
Original Mortgage
$465,000,000
Interest Rate
6.71%
Mortgage Type
Commercial
Create a Home Valuation Report for This Property
The Home Valuation Report is an in-depth analysis detailing your home's value as well as a comparison with similar homes in the area
Home Values in the Area
Average Home Value in this Area
Purchase History
| Date | Buyer | Sale Price | Title Company |
|---|---|---|---|
| Ah Rri Hotel Llc | $4,000,000 | Chicago Title | |
| Four Apart Llc | $2,254,000 | None Available | |
| Fmw Rri Nc Llc | -- | None Available | |
| R & Roof Ii Llc | $5,000 | Ctic | |
| R & Roof Ii Llc | $4,625,500 | Ctic |
Source: Public Records
Mortgage History
| Date | Status | Borrower | Loan Amount |
|---|---|---|---|
| Open | Ah Rri Hotel Llc | $5,000,000 | |
| Previous Owner | Four Apart Llc | $1,837,500 | |
| Previous Owner | R & Roof Ii Llc | $465,000,000 |
Source: Public Records
Tax History Compared to Growth
Tax History
| Year | Tax Paid | Tax Assessment Tax Assessment Total Assessment is a certain percentage of the fair market value that is determined by local assessors to be the total taxable value of land and additions on the property. | Land | Improvement |
|---|---|---|---|---|
| 2024 | $131,784 | $486,140 | $134,794 | $351,346 |
| 2023 | $109,860 | $536,226 | $134,794 | $401,432 |
| 2022 | $109,860 | $445,107 | $134,794 | $310,313 |
| 2021 | $110,546 | $391,157 | $134,793 | $256,364 |
| 2020 | $107,387 | $391,157 | $134,793 | $256,364 |
| 2019 | $92,715 | $372,789 | $134,793 | $237,996 |
| 2018 | $80,284 | $287,057 | $114,574 | $172,483 |
| 2017 | $96,078 | $348,551 | $114,574 | $233,977 |
| 2016 | $54,302 | $210,537 | $114,574 | $95,963 |
| 2015 | $63,326 | $228,314 | $94,355 | $133,959 |
| 2014 | $62,509 | $228,314 | $94,355 | $133,959 |
| 2013 | $60,998 | $228,314 | $94,355 | $133,959 |
Source: Public Records
Map
Nearby Homes
- 2234 S Crambourne Way
- 2206 S Goebbert Rd Unit 409
- 2315 S Goebbert Rd Unit D209
- 2342 S Shag Bark Trail
- 1020 Arbor Ct
- 1016 Arbor Ct
- 1008 Arbor Ct
- 700 S Noah Terrace
- 2669 S Embers Ln Unit 142669
- 1607 S Kaspar Ave
- 1535 S Douglas Ave
- 1822 W Catalpa Ln
- 808 S Deborah Ln
- 1107 E Algonquin Rd Unit 4
- 1111 E Algonquin Rd Unit 1
- 1813 W Pheasant Trail
- 1355 S Dunton Ave
- 2121 W Haven St
- 1119 E Algonquin Rd Unit 2
- 1119 E Algonquin Rd Unit 7
- 256 W Algonquin Rd
- 2120 S Arlington Heights Rd
- 606 E Algonquin Rd Unit I202
- 606 E Algonquin Rd Unit I105
- 606 E Algonquin Rd Unit I205
- 606 E Algonquin Rd Unit I104
- 606 E Algonquin Rd Unit I106
- 606 E Algonquin Rd Unit I101
- 606 E Algonquin Rd Unit I103
- 606 E Algonquin Rd Unit I102
- 606 E Algonquin Rd Unit I206
- 606 E Algonquin Rd Unit I204
- 606 E Algonquin Rd Unit I203
- 606 E Algonquin Rd Unit I201
- 606 E Algonquin Rd Unit 201
- 2229 S Crambourne Way
- 2226 S Crambourne Way
- 2224 S Crambourne Way
- 2222 S Crambourne Way
- 2221 S Crambourne Way