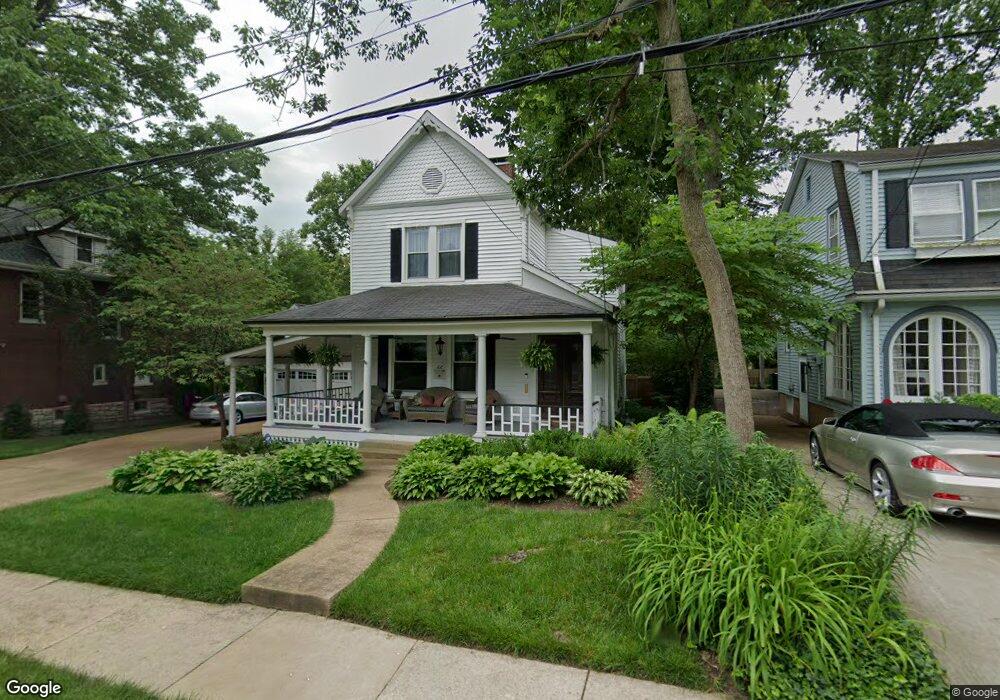
22 W Cedar Ave Saint Louis, MO 63119
Estimated Value: $674,372 - $762,000
3
Beds
3
Baths
2,018
Sq Ft
$354/Sq Ft
Est. Value
About This Home
This home is located at 22 W Cedar Ave, Saint Louis, MO 63119 and is currently estimated at $715,343, approximately $354 per square foot. 22 W Cedar Ave is a home located in St. Louis County with nearby schools including Bristol Elementary School, Hixson Middle School, and Webster Groves High School.
Ownership History
Date
Name
Owned For
Owner Type
Purchase Details
Closed on
Aug 29, 2019
Sold by
Thomas Keith J and Thomas Patrice C
Bought by
Thomas Keith J and Thomas Patrice C
Current Estimated Value
Purchase Details
Closed on
Jun 27, 2007
Sold by
Hopkins Deborah R and Hopkins Stephen M
Bought by
Thomas Keith J and Thomas Patrice C
Home Financials for this Owner
Home Financials are based on the most recent Mortgage that was taken out on this home.
Original Mortgage
$200,000
Outstanding Balance
$123,567
Interest Rate
6.37%
Mortgage Type
Purchase Money Mortgage
Estimated Equity
$591,776
Purchase Details
Closed on
Jul 10, 2002
Sold by
Gaines James H and Gaines Janette M
Bought by
Hopkins Stephen M and Hopkins Deborah R
Home Financials for this Owner
Home Financials are based on the most recent Mortgage that was taken out on this home.
Original Mortgage
$145,000
Interest Rate
5.75%
Purchase Details
Closed on
Jul 31, 1998
Sold by
Gaines James H and Gaines Janette M
Bought by
Gaines James H and Gaines Janette M
Create a Home Valuation Report for This Property
The Home Valuation Report is an in-depth analysis detailing your home's value as well as a comparison with similar homes in the area
Home Values in the Area
Average Home Value in this Area
Purchase History
| Date | Buyer | Sale Price | Title Company |
|---|---|---|---|
| Thomas Keith J | -- | None Available | |
| Thomas Keith J | $340,000 | None Available | |
| Hopkins Stephen M | $275,000 | -- | |
| Gaines James H | -- | -- |
Source: Public Records
Mortgage History
| Date | Status | Borrower | Loan Amount |
|---|---|---|---|
| Open | Thomas Keith J | $200,000 | |
| Previous Owner | Hopkins Stephen M | $145,000 |
Source: Public Records
Tax History Compared to Growth
Tax History
| Year | Tax Paid | Tax Assessment Tax Assessment Total Assessment is a certain percentage of the fair market value that is determined by local assessors to be the total taxable value of land and additions on the property. | Land | Improvement |
|---|---|---|---|---|
| 2025 | $7,020 | $123,460 | $76,340 | $47,120 |
| 2024 | $7,020 | $101,120 | $52,500 | $48,620 |
| 2023 | $6,986 | $101,120 | $52,500 | $48,620 |
| 2022 | $6,384 | $85,770 | $52,500 | $33,270 |
| 2021 | $6,362 | $85,770 | $52,500 | $33,270 |
| 2020 | $6,466 | $81,220 | $56,920 | $24,300 |
| 2019 | $5,897 | $74,550 | $56,920 | $17,630 |
| 2018 | $5,689 | $63,860 | $47,560 | $16,300 |
| 2017 | $5,651 | $63,860 | $47,560 | $16,300 |
| 2016 | $5,905 | $63,900 | $38,080 | $25,820 |
| 2015 | $5,936 | $63,900 | $38,080 | $25,820 |
| 2014 | $5,786 | $60,610 | $18,450 | $42,160 |
Source: Public Records
Map
Nearby Homes
- 156 Gray Ave
- 234 Plant Ave
- 340 Gray Ave
- 200 Blackmer Place
- 368 S Gore Ave
- 203 E Jackson Rd
- 426 S Maple Ave
- 136 N Gore Ave
- 404 W Kirkham Ave
- 125 E Frisco Ave
- 8361 Big Bend Blvd
- 426 W Kirkham Ave
- 112 Oakwood Ave
- 514 S Gore Ave
- 450 E Lockwood Ave Unit 303
- 426 Pasadena Ave
- 539 Colebrook Dr Unit B
- 42 Chestnut Ave
- 541 W Kirkham Ave
- 218 Euclid Ave