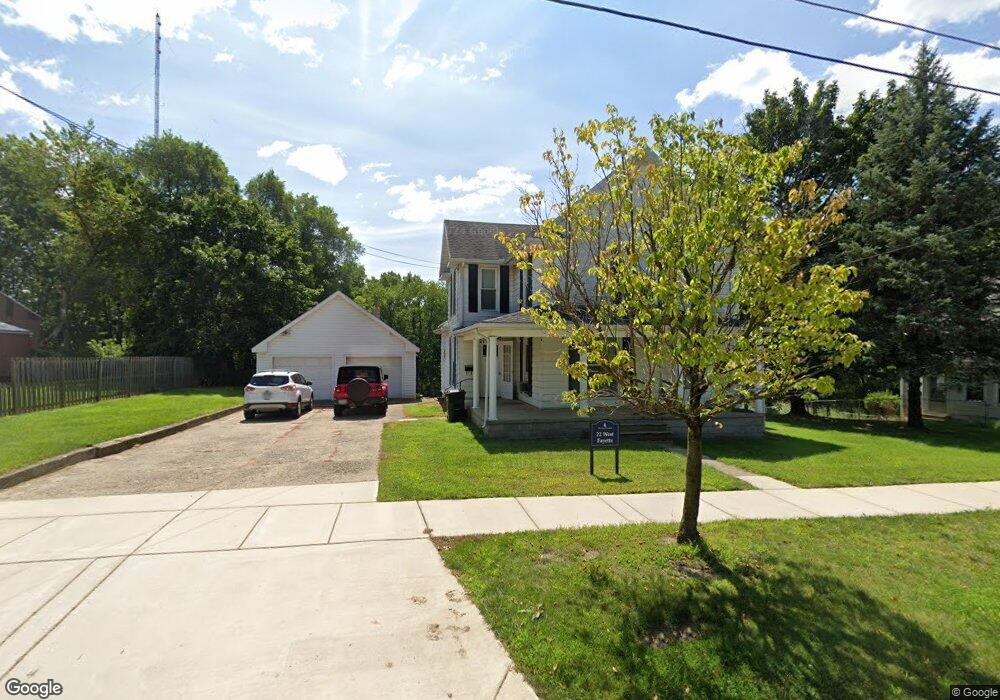
22 W Fayette St Hillsdale, MI 49242
Estimated Value: $188,000 - $227,000
--
Bed
2
Baths
1,118
Sq Ft
$184/Sq Ft
Est. Value
About This Home
This home is located at 22 W Fayette St, Hillsdale, MI 49242 and is currently estimated at $205,809, approximately $184 per square foot. 22 W Fayette St is a home located in Hillsdale County with nearby schools including Bailey Early Childhood Center, Gier Elementary School, and Davis Middle School.
Ownership History
Date
Name
Owned For
Owner Type
Purchase Details
Closed on
Oct 27, 2017
Sold by
Seiple Gayle M
Bought by
Hillsdale College
Current Estimated Value
Purchase Details
Closed on
Oct 26, 2016
Sold by
Hartwick Kent M
Bought by
Hartwick Kent M and Foral Lyndall M
Purchase Details
Closed on
Jan 21, 2004
Sold by
Hartwick Angela S
Bought by
Hartwick Kent M
Purchase Details
Closed on
Apr 24, 1999
Sold by
Hartwick Kent
Bought by
Hartwick Kent and Hartwick Angela
Create a Home Valuation Report for This Property
The Home Valuation Report is an in-depth analysis detailing your home's value as well as a comparison with similar homes in the area
Home Values in the Area
Average Home Value in this Area
Purchase History
| Date | Buyer | Sale Price | Title Company |
|---|---|---|---|
| Hillsdale College | $87,500 | Public Title Company | |
| Seiple Gayle M | -- | Public Title Company | |
| Hartwick Kent M | -- | Attorney | |
| Hartwick Kent M | -- | Midstate Title Company | |
| Hartwick Kent | -- | -- |
Source: Public Records
Tax History Compared to Growth
Tax History
| Year | Tax Paid | Tax Assessment Tax Assessment Total Assessment is a certain percentage of the fair market value that is determined by local assessors to be the total taxable value of land and additions on the property. | Land | Improvement |
|---|---|---|---|---|
| 2025 | -- | $90,590 | $42,538 | $48,052 |
| 2024 | -- | $111,984 | $75,000 | $36,984 |
| 2023 | -- | $62,068 | $12,447 | $49,621 |
| 2022 | -- | $55,588 | $6,840 | $48,748 |
| 2021 | $0 | $54,970 | $9,000 | $45,970 |
| 2020 | $2,783 | $53,500 | $0 | $0 |
| 2019 | $2,713 | $50,200 | $0 | $0 |
| 2018 | $2,569 | $44,700 | $0 | $0 |
| 2017 | $1,252 | $42,900 | $0 | $0 |
| 2016 | $1,145 | $31,900 | $0 | $0 |
| 2015 | $955 | $31,900 | $0 | $0 |
| 2013 | -- | $42,420 | $0 | $0 |
| 2012 | -- | $30,510 | $0 | $0 |
Source: Public Records
Map
Nearby Homes