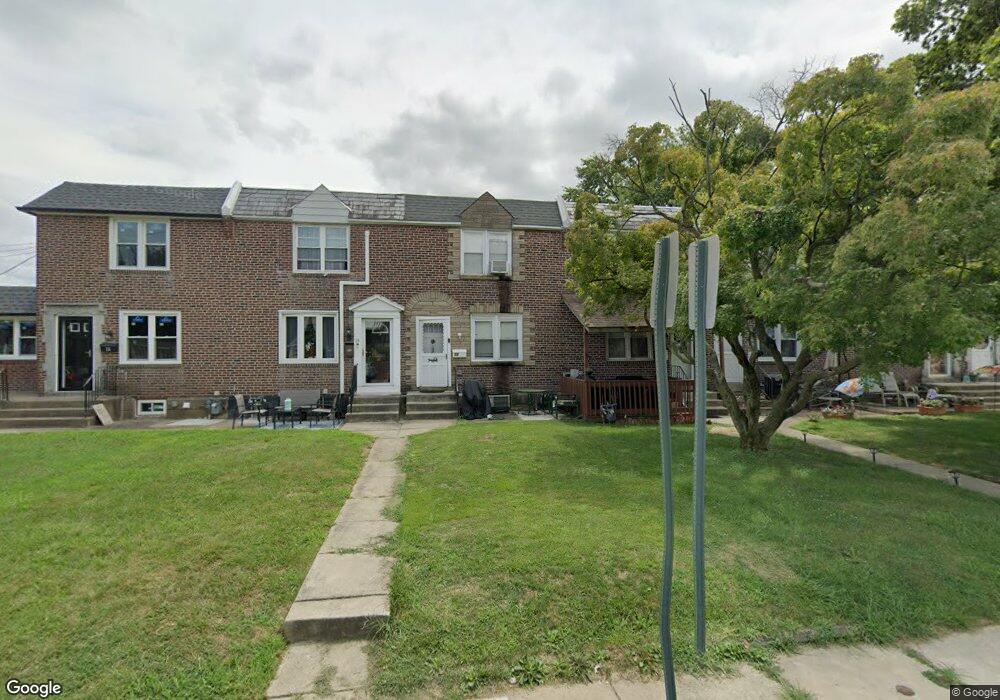
22 W Madison Ave Clifton Heights, PA 19018
Estimated Value: $201,909 - $212,000
3
Beds
1
Bath
1,152
Sq Ft
$179/Sq Ft
Est. Value
About This Home
This home is located at 22 W Madison Ave, Clifton Heights, PA 19018 and is currently estimated at $206,727, approximately $179 per square foot. 22 W Madison Ave is a home located in Delaware County with nearby schools including Primos El School, Drexel Hill Middle School, and Upper Darby High School.
Ownership History
Date
Name
Owned For
Owner Type
Purchase Details
Closed on
Oct 29, 2001
Sold by
Cloar James and Cloar Marla
Bought by
Tiger Relocation Company
Current Estimated Value
Home Financials for this Owner
Home Financials are based on the most recent Mortgage that was taken out on this home.
Original Mortgage
$50,000
Outstanding Balance
$19,300
Interest Rate
6.7%
Mortgage Type
Purchase Money Mortgage
Estimated Equity
$187,427
Purchase Details
Closed on
Oct 24, 2001
Sold by
Tiger Relocation Co
Bought by
Persia Mark and Persia Barbara
Home Financials for this Owner
Home Financials are based on the most recent Mortgage that was taken out on this home.
Original Mortgage
$50,000
Outstanding Balance
$19,300
Interest Rate
6.7%
Mortgage Type
Purchase Money Mortgage
Estimated Equity
$187,427
Purchase Details
Closed on
Jan 23, 1996
Sold by
Cloar Paul J and Cloar James D
Bought by
Cloar James and Cloar Marla
Create a Home Valuation Report for This Property
The Home Valuation Report is an in-depth analysis detailing your home's value as well as a comparison with similar homes in the area
Home Values in the Area
Average Home Value in this Area
Purchase History
| Date | Buyer | Sale Price | Title Company |
|---|---|---|---|
| Tiger Relocation Company | $1,801 | -- | |
| Persia Mark | $45,500 | First American Title Ins Co | |
| Cloar James | -- | -- |
Source: Public Records
Mortgage History
| Date | Status | Borrower | Loan Amount |
|---|---|---|---|
| Open | Persia Mark | $50,000 |
Source: Public Records
Tax History Compared to Growth
Tax History
| Year | Tax Paid | Tax Assessment Tax Assessment Total Assessment is a certain percentage of the fair market value that is determined by local assessors to be the total taxable value of land and additions on the property. | Land | Improvement |
|---|---|---|---|---|
| 2025 | $3,780 | $95,690 | $32,250 | $63,440 |
| 2024 | $3,780 | $95,690 | $32,250 | $63,440 |
| 2023 | $3,742 | $95,690 | $32,250 | $63,440 |
| 2022 | $3,719 | $95,690 | $32,250 | $63,440 |
| 2021 | $5,078 | $95,690 | $32,250 | $63,440 |
| 2020 | $2,472 | $42,036 | $24,810 | $17,226 |
| 2019 | $2,442 | $42,036 | $24,810 | $17,226 |
| 2018 | $2,370 | $42,036 | $0 | $0 |
| 2017 | $3,758 | $42,036 | $0 | $0 |
| 2016 | $231 | $67,940 | $0 | $0 |
| 2015 | $373 | $67,940 | $0 | $0 |
| 2014 | $373 | $67,940 | $0 | $0 |
Source: Public Records
Map
Nearby Homes
- 531 Chester Ave
- 514 Chester Ave
- 217 Priscilla Ln
- 126 Academy Rd
- 36 E Washington Ave
- 30 S Diamond St
- 424 S Church St
- 45 S Sycamore Ave
- 112 S Church St
- 65 S Church St
- 201 Cambridge Rd
- 230 W Washington Ave
- 203 S Oak Ave
- 105 N Diamond St
- 9 Harrison Ave
- 309 S Oak Ave
- 120 N Diamond St
- 82 Marple Ave
- 208 Rosewood Ave
- 130 N Diamond St
- 24 W Madison Ave
- 20 W Madison Ave
- 26 W Madison Ave
- 28 W Madison Ave
- 18 W Madison Ave
- 16 W Madison Ave
- 30 W Madison Ave
- 34 W Madison Ave
- 14 W Madison Ave
- 36 W Madison Ave
- 38 W Madison Ave
- 40 W Madison Ave
- 19 W Madison Ave
- 17 W Madison Ave
- 44 W Madison Ave
- 19 E Madison Ave
- 23 W Madison Ave
- 25 W Madison Ave
- 27 W Madison Ave
- 46 W Madison Ave