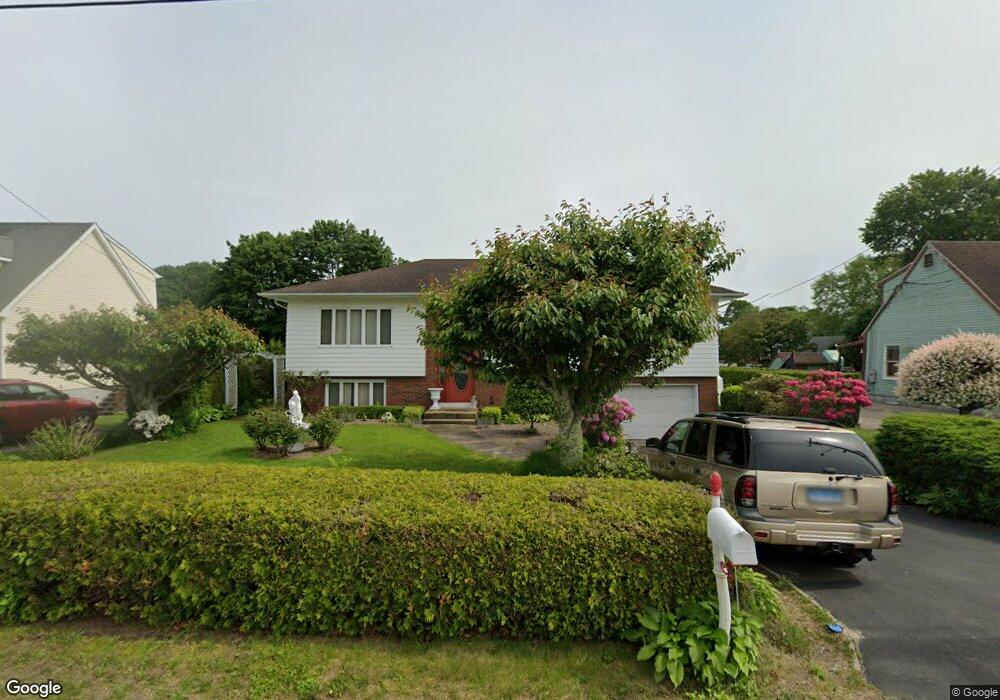
22 W Vine St Pawcatuck, CT 06379
Estimated Value: $372,000 - $462,000
3
Beds
2
Baths
1,288
Sq Ft
$324/Sq Ft
Est. Value
About This Home
This home is located at 22 W Vine St, Pawcatuck, CT 06379 and is currently estimated at $416,809, approximately $323 per square foot. 22 W Vine St is a home located in New London County with nearby schools including Stonington Middle School, Stonington High School, and North Stonington Christian Academy.
Ownership History
Date
Name
Owned For
Owner Type
Purchase Details
Closed on
Jun 27, 2017
Sold by
Tavares Laureno
Bought by
Tavares Laureno and Tavares Maria
Current Estimated Value
Home Financials for this Owner
Home Financials are based on the most recent Mortgage that was taken out on this home.
Original Mortgage
$163,000
Outstanding Balance
$136,017
Interest Rate
4.05%
Mortgage Type
New Conventional
Estimated Equity
$280,792
Create a Home Valuation Report for This Property
The Home Valuation Report is an in-depth analysis detailing your home's value as well as a comparison with similar homes in the area
Home Values in the Area
Average Home Value in this Area
Purchase History
| Date | Buyer | Sale Price | Title Company |
|---|---|---|---|
| Tavares Laureno | -- | -- | |
| Tavares Laureno | -- | -- |
Source: Public Records
Mortgage History
| Date | Status | Borrower | Loan Amount |
|---|---|---|---|
| Open | Tavares Laureno | $163,000 |
Source: Public Records
Tax History Compared to Growth
Tax History
| Year | Tax Paid | Tax Assessment Tax Assessment Total Assessment is a certain percentage of the fair market value that is determined by local assessors to be the total taxable value of land and additions on the property. | Land | Improvement |
|---|---|---|---|---|
| 2025 | $4,672 | $235,000 | $59,600 | $175,400 |
| 2024 | $4,477 | $235,000 | $59,600 | $175,400 |
| 2023 | $4,477 | $235,000 | $59,600 | $175,400 |
| 2022 | $3,744 | $146,200 | $49,200 | $97,000 |
| 2021 | $3,750 | $146,200 | $49,200 | $97,000 |
| 2020 | $3,678 | $146,200 | $49,200 | $97,000 |
| 2019 | $3,671 | $146,200 | $49,200 | $97,000 |
| 2018 | $3,547 | $146,200 | $49,200 | $97,000 |
| 2017 | $3,117 | $126,600 | $41,100 | $85,500 |
| 2016 | $3,032 | $126,600 | $41,100 | $85,500 |
| 2015 | $2,846 | $126,600 | $41,100 | $85,500 |
| 2014 | $2,784 | $126,600 | $41,100 | $85,500 |
Source: Public Records
Map
Nearby Homes
- 15 Faulise Ave
- 12 Avery St
- 27 Liberty St
- Lot 2, 770 Pequot Trail
- 7 Ava St
- 4 Pearl St
- 19 Pleasant St
- 13 Palmer St
- 140 High St Unit 307
- 77 Mechanic St
- 38 Newton Ave
- 145 High St Unit D
- 52 Spruce St
- 52 William St
- 4 N Joseph St
- 38 Prospect St
- 3 Joseph Ln
- 49 Lathrop Ave
- 25 School St Unit 4
- 25 School St Unit 2