Estimated Value: $88,816 - $154,000
--
Bed
1
Bath
1,010
Sq Ft
$123/Sq Ft
Est. Value
About This Home
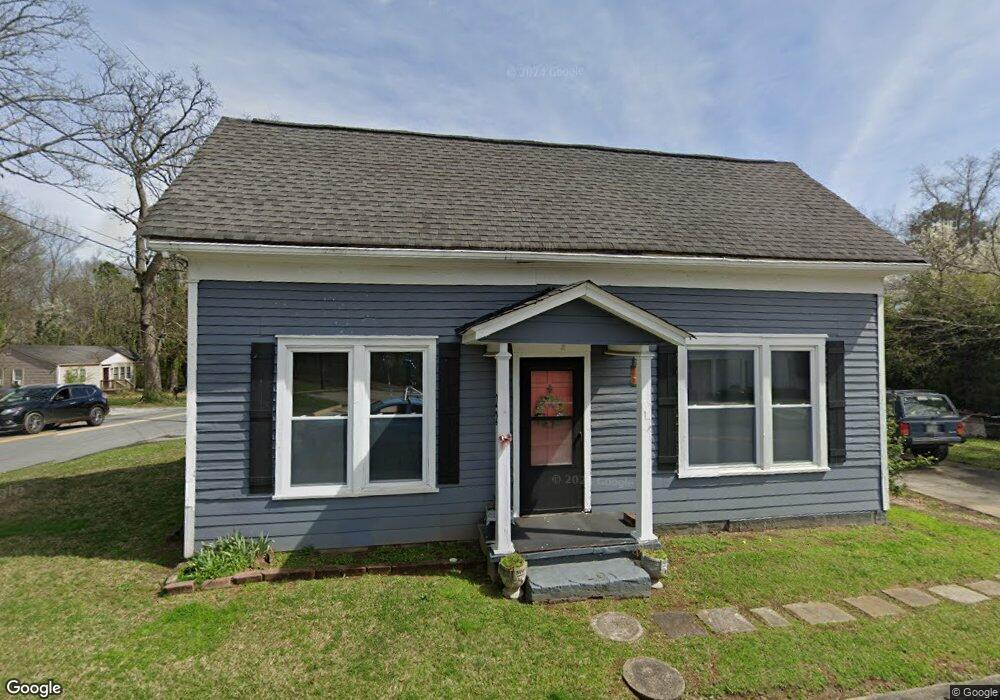
This home is located at 22 Watson St NW, Rome, GA 30165 and is currently estimated at $124,204, approximately $122 per square foot. 22 Watson St NW is a home located in Floyd County with nearby schools including Rome High School and St. Mary School.
Ownership History
Date
Name
Owned For
Owner Type
Purchase Details
Closed on
Jun 26, 2001
Sold by
Bridges Brenda L and Bridges James W
Bought by
Poe James W and Poe Deborah F
Current Estimated Value
Purchase Details
Closed on
Nov 18, 1988
Sold by
Branton John E and Ann Branton
Bought by
Bridges James L and Bridges Brenda L
Purchase Details
Closed on
Sep 24, 1984
Sold by
Storey James W and Storey Flora M
Bought by
Branton John E and Ann Branton
Purchase Details
Closed on
Nov 26, 1979
Sold by
Morgan Jackson D
Bought by
Storey James W and Storey Flora M
Purchase Details
Closed on
Jun 20, 1977
Sold by
Newberry Bobby Lee
Bought by
Morgan Jackson D
Purchase Details
Closed on
May 9, 1975
Sold by
Humphries Ruby P Parker R O Guy H and Humphries Sl
Bought by
Newberry Bobby Lee
Purchase Details
Closed on
Oct 15, 1965
Bought by
P and R
Purchase Details
Closed on
Oct 14, 1965
Sold by
Parker S T Est
Bought by
Humphries Ruby P Parker R O Guy H
Purchase Details
Closed on
Jan 1, 1901
Bought by
Parker S T Est
Create a Home Valuation Report for This Property
The Home Valuation Report is an in-depth analysis detailing your home's value as well as a comparison with similar homes in the area
Home Values in the Area
Average Home Value in this Area
Purchase History
| Date | Buyer | Sale Price | Title Company |
|---|---|---|---|
| Poe James W | -- | -- | |
| Bridges Brenda L | -- | -- | |
| Bridges James L | $16,500 | -- | |
| Branton John E | $17,000 | -- | |
| Storey James W | $13,100 | -- | |
| Morgan Jackson D | $11,900 | -- | |
| Newberry Bobby Lee | $8,000 | -- | |
| P | -- | -- | |
| Humphries Ruby P Parker R O Guy H | -- | -- | |
| Parker S T Est | -- | -- |
Source: Public Records
Tax History Compared to Growth
Tax History
| Year | Tax Paid | Tax Assessment Tax Assessment Total Assessment is a certain percentage of the fair market value that is determined by local assessors to be the total taxable value of land and additions on the property. | Land | Improvement |
|---|---|---|---|---|
| 2024 | $256 | $34,459 | $7,441 | $27,018 |
| 2023 | $655 | $23,923 | $6,614 | $17,309 |
| 2022 | $644 | $21,979 | $5,512 | $16,467 |
| 2021 | $616 | $19,949 | $5,512 | $14,437 |
| 2020 | $579 | $17,611 | $4,134 | $13,477 |
| 2019 | $558 | $16,630 | $4,134 | $12,496 |
| 2018 | $561 | $16,812 | $4,134 | $12,678 |
| 2017 | $550 | $16,174 | $4,134 | $12,040 |
| 2016 | $563 | $16,876 | $4,120 | $12,756 |
| 2015 | $533 | $16,876 | $4,120 | $12,756 |
| 2014 | $533 | $16,817 | $4,120 | $12,697 |
Source: Public Records
Map
Nearby Homes
- 15 Alexander St
- 100 Dellwood Dr NW
- 4 Homestead Cir NW
- 214 N Elm St NW
- 103 Wooten Dr SW
- 8 Leon St SW
- 40 Paris Dr SW
- 26 Jefferson Dr SW
- 16 Jefferson Dr SW
- 209 Larkspur Ln SW
- 0 Cedartown Rd Unit 10479932
- 23 Sweetspire Dr NW
- 21 Sweetspire Dr NW
- 15 Silverbell Ln
- 110 Williamson St SW
- 43 Westwood Cir SW
- 18 Butler Cir NW
- 431 N Elm St NW
- 18 Watson St NW
- 429 N Elm St NW
- 430 N Elm St NW
- 428 N Elm St NW
- 14 Watson St NW
- 426 N Elm St NW
- 427 N Elm St NW
- 106 Watson St NW
- 422 N Elm St NW
- 423 N Elm St NW
- 11 Whiteway Dr NW
- 105 Watson St NW
- 418 N Elm St NW
- 110 Watson St NW
- 9 Whiteway Dr NW
- 0 Whiteway Dr Unit 7475888
- 0 Whiteway Dr Unit 8279782
- 0 Whiteway Dr Unit 3103366
- 0 Whiteway Dr