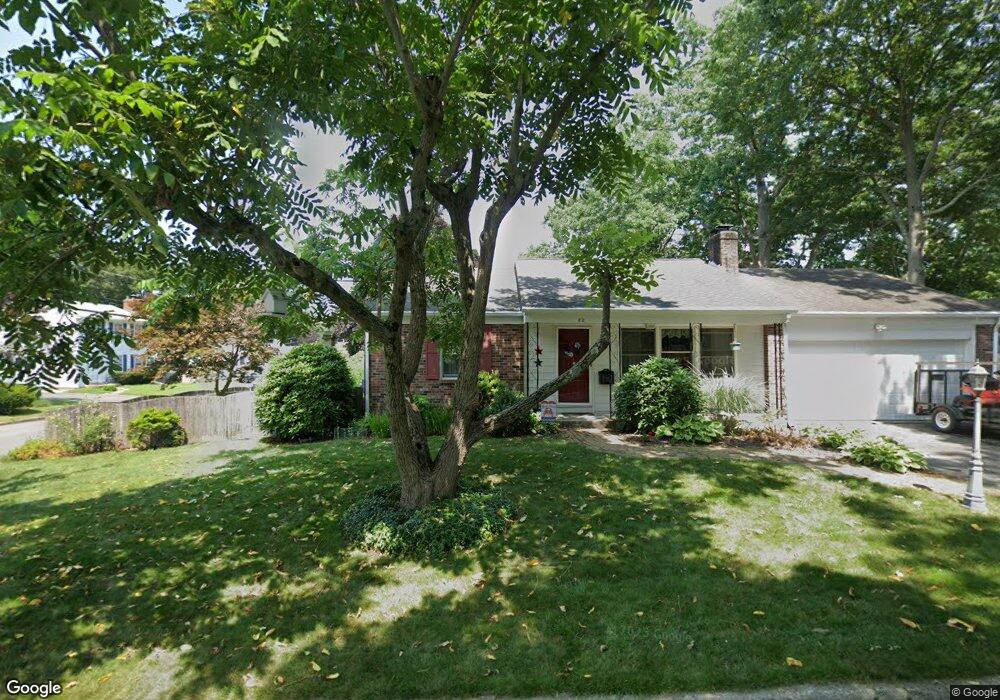
22 Waverly Rd Riverside, RI 02915
Riverside NeighborhoodEstimated Value: $437,000 - $469,000
3
Beds
3
Baths
1,810
Sq Ft
$248/Sq Ft
Est. Value
About This Home
This home is located at 22 Waverly Rd, Riverside, RI 02915 and is currently estimated at $449,693, approximately $248 per square foot. 22 Waverly Rd is a home located in Providence County with nearby schools including East Providence High School, St Luke Elementary School, and St Mary Academy-Bay View.
Ownership History
Date
Name
Owned For
Owner Type
Purchase Details
Closed on
Jun 5, 1996
Sold by
Distefano Salvatore and Distefano Christine
Bought by
Duarte Paul and Duarte Susan
Current Estimated Value
Home Financials for this Owner
Home Financials are based on the most recent Mortgage that was taken out on this home.
Original Mortgage
$75,000
Outstanding Balance
$3,714
Interest Rate
7.89%
Mortgage Type
Purchase Money Mortgage
Estimated Equity
$445,979
Purchase Details
Closed on
Jul 23, 1990
Sold by
Witherall George E
Bought by
Distefano Salvatore
Home Financials for this Owner
Home Financials are based on the most recent Mortgage that was taken out on this home.
Original Mortgage
$108,000
Interest Rate
9.94%
Mortgage Type
Purchase Money Mortgage
Create a Home Valuation Report for This Property
The Home Valuation Report is an in-depth analysis detailing your home's value as well as a comparison with similar homes in the area
Home Values in the Area
Average Home Value in this Area
Purchase History
| Date | Buyer | Sale Price | Title Company |
|---|---|---|---|
| Duarte Paul | $135,000 | -- | |
| Distefano Salvatore | $135,000 | -- | |
| Duarte Paul | $135,000 | -- | |
| Distefano Salvatore | $135,000 | -- |
Source: Public Records
Mortgage History
| Date | Status | Borrower | Loan Amount |
|---|---|---|---|
| Open | Distefano Salvatore | $75,000 | |
| Closed | Distefano Salvatore | $75,000 | |
| Previous Owner | Distefano Salvatore | $108,000 |
Source: Public Records
Tax History Compared to Growth
Tax History
| Year | Tax Paid | Tax Assessment Tax Assessment Total Assessment is a certain percentage of the fair market value that is determined by local assessors to be the total taxable value of land and additions on the property. | Land | Improvement |
|---|---|---|---|---|
| 2025 | $5,053 | $386,600 | $127,100 | $259,500 |
| 2024 | $5,063 | $330,300 | $106,000 | $224,300 |
| 2023 | $4,875 | $330,300 | $106,000 | $224,300 |
| 2022 | $4,750 | $217,300 | $51,800 | $165,500 |
| 2021 | $4,672 | $217,300 | $51,600 | $165,700 |
| 2020 | $4,474 | $217,300 | $51,600 | $165,700 |
| 2019 | $4,350 | $217,300 | $51,600 | $165,700 |
| 2018 | $4,562 | $199,400 | $62,800 | $136,600 |
| 2017 | $4,461 | $199,400 | $62,800 | $136,600 |
| 2016 | $4,439 | $199,400 | $62,800 | $136,600 |
| 2015 | $4,301 | $187,400 | $53,100 | $134,300 |
| 2014 | $4,301 | $187,400 | $53,100 | $134,300 |
Source: Public Records
Map
Nearby Homes