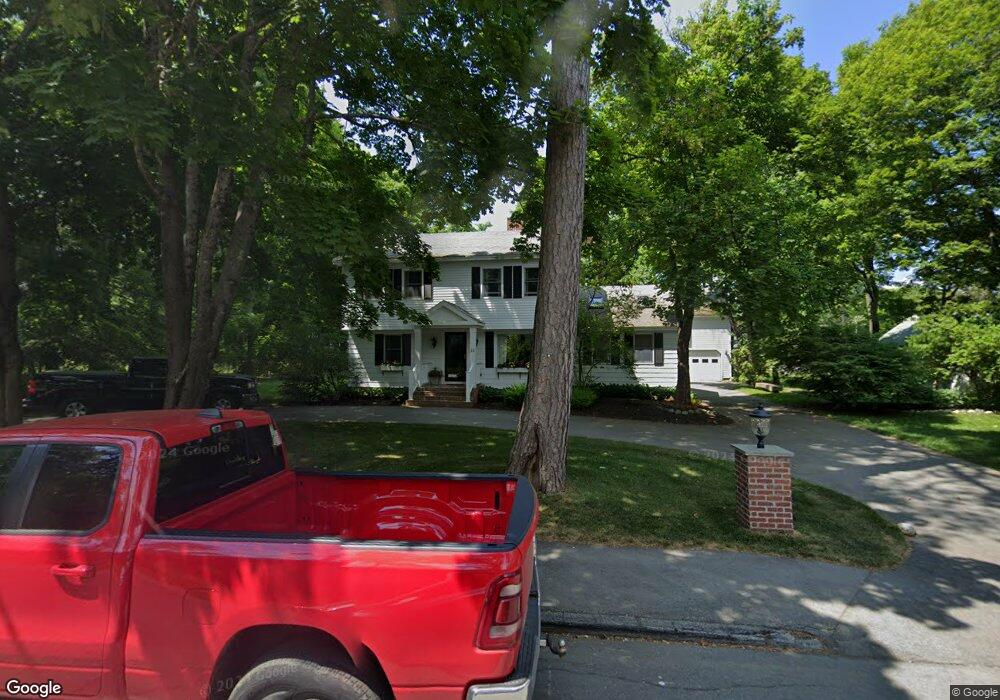
22 Wayman Ln Bar Harbor, ME 04609
Estimated Value: $984,000 - $1,394,324
3
Beds
4
Baths
2,819
Sq Ft
$415/Sq Ft
Est. Value
About This Home
This home is located at 22 Wayman Ln, Bar Harbor, ME 04609 and is currently estimated at $1,169,831, approximately $414 per square foot. 22 Wayman Ln is a home located in Hancock County with nearby schools including Conners-Emerson School, Mt. Desert Island High School, and Acadia School.
Ownership History
Date
Name
Owned For
Owner Type
Purchase Details
Closed on
Dec 20, 2012
Sold by
Cooper Ft
Bought by
Swan Cary B
Current Estimated Value
Home Financials for this Owner
Home Financials are based on the most recent Mortgage that was taken out on this home.
Original Mortgage
$544,000
Outstanding Balance
$387,894
Interest Rate
4%
Mortgage Type
Adjustable Rate Mortgage/ARM
Estimated Equity
$781,937
Purchase Details
Closed on
Mar 30, 2005
Sold by
Swan Cary B
Bought by
Swan Kimberly and Swan Cary B
Create a Home Valuation Report for This Property
The Home Valuation Report is an in-depth analysis detailing your home's value as well as a comparison with similar homes in the area
Home Values in the Area
Average Home Value in this Area
Purchase History
| Date | Buyer | Sale Price | Title Company |
|---|---|---|---|
| Swan Cary B | -- | -- | |
| Swan Kimberly | -- | -- |
Source: Public Records
Mortgage History
| Date | Status | Borrower | Loan Amount |
|---|---|---|---|
| Open | Swan Cary B | $544,000 |
Source: Public Records
Tax History Compared to Growth
Tax History
| Year | Tax Paid | Tax Assessment Tax Assessment Total Assessment is a certain percentage of the fair market value that is determined by local assessors to be the total taxable value of land and additions on the property. | Land | Improvement |
|---|---|---|---|---|
| 2024 | $9,048 | $901,200 | $554,200 | $347,000 |
| 2023 | $7,822 | $901,200 | $554,200 | $347,000 |
| 2022 | $7,107 | $762,600 | $468,900 | $293,700 |
| 2021 | $6,753 | $693,300 | $426,300 | $267,000 |
| 2020 | $7,017 | $589,700 | $352,400 | $237,300 |
| 2019 | $6,919 | $583,900 | $348,900 | $235,000 |
| 2018 | $6,750 | $583,900 | $348,900 | $235,000 |
| 2017 | $6,400 | $583,900 | $348,900 | $235,000 |
| 2016 | $6,265 | $583,900 | $348,900 | $235,000 |
| 2015 | $5,931 | $560,100 | $348,900 | $211,200 |
| 2014 | $5,724 | $560,100 | $348,900 | $211,200 |
| 2012 | $5,511 | $560,100 | $348,900 | $211,200 |
Source: Public Records
Map
Nearby Homes