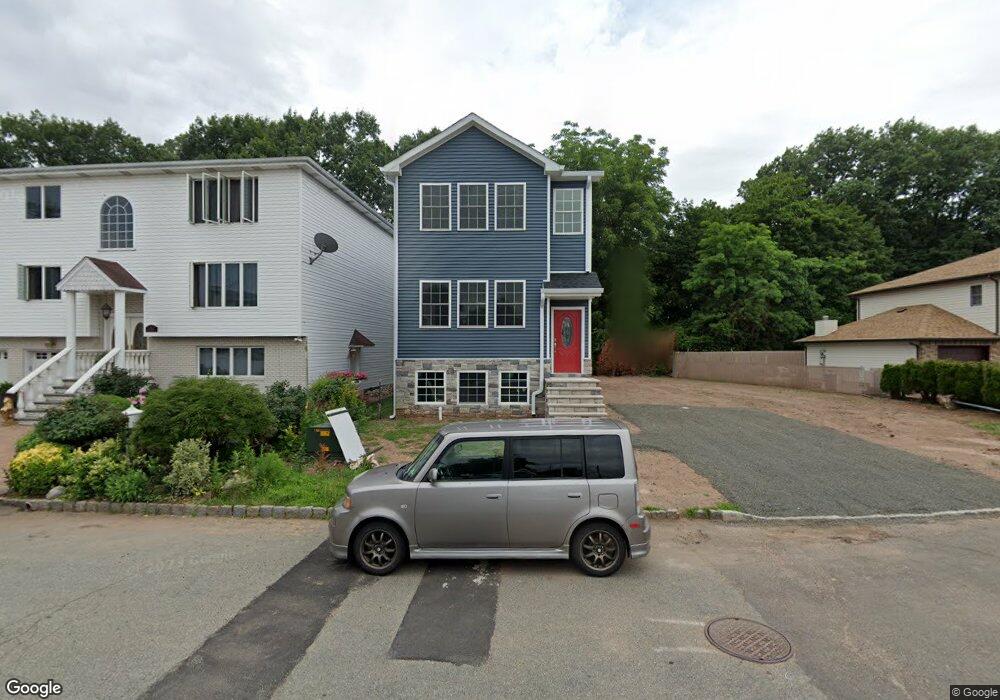
22 Willow Wood Square Unit 5471 East Rutherford, NJ 07073
Estimated Value: $426,000 - $442,000
2
Beds
2
Baths
1,176
Sq Ft
$368/Sq Ft
Est. Value
About This Home
This home is located at 22 Willow Wood Square Unit 5471, East Rutherford, NJ 07073 and is currently estimated at $432,952, approximately $368 per square foot. 22 Willow Wood Square Unit 5471 is a home located in Bergen County with nearby schools including Mckenzie School, Alfred Faust School, and Henry P Becton Regional High School.
Ownership History
Date
Name
Owned For
Owner Type
Purchase Details
Closed on
Oct 12, 2018
Sold by
Joseph Francis B and Joseph Dina M
Bought by
Zhang Hui
Current Estimated Value
Purchase Details
Closed on
Apr 14, 2010
Sold by
Guldal Gulbin
Bought by
Joseph Francis B and Joseph Dina Marie
Home Financials for this Owner
Home Financials are based on the most recent Mortgage that was taken out on this home.
Original Mortgage
$264,500
Interest Rate
4.97%
Mortgage Type
Purchase Money Mortgage
Purchase Details
Closed on
Nov 21, 2005
Sold by
Gucciardo Louis
Bought by
Guldal Gulbin
Home Financials for this Owner
Home Financials are based on the most recent Mortgage that was taken out on this home.
Original Mortgage
$268,000
Interest Rate
6.34%
Create a Home Valuation Report for This Property
The Home Valuation Report is an in-depth analysis detailing your home's value as well as a comparison with similar homes in the area
Home Values in the Area
Average Home Value in this Area
Purchase History
| Date | Buyer | Sale Price | Title Company |
|---|---|---|---|
| Zhang Hui | $275,000 | -- | |
| Joseph Francis B | $270,000 | -- | |
| Guldal Gulbin | $335,000 | -- |
Source: Public Records
Mortgage History
| Date | Status | Borrower | Loan Amount |
|---|---|---|---|
| Previous Owner | Joseph Francis B | $264,500 | |
| Previous Owner | Guldal Gulbin | $268,000 |
Source: Public Records
Tax History Compared to Growth
Tax History
| Year | Tax Paid | Tax Assessment Tax Assessment Total Assessment is a certain percentage of the fair market value that is determined by local assessors to be the total taxable value of land and additions on the property. | Land | Improvement |
|---|---|---|---|---|
| 2025 | $5,241 | $337,400 | $194,000 | $143,400 |
| 2024 | $4,991 | $323,300 | $185,800 | $137,500 |
| 2023 | $4,852 | $307,500 | $173,600 | $133,900 |
| 2022 | $4,852 | $277,100 | $182,500 | $94,600 |
| 2021 | $4,785 | $266,300 | $174,500 | $91,800 |
| 2020 | $4,753 | $261,300 | $171,100 | $90,200 |
| 2019 | $5,038 | $275,000 | $182,300 | $92,700 |
| 2018 | $4,319 | $242,900 | $151,500 | $91,400 |
| 2017 | $5,046 | $243,300 | $164,600 | $78,700 |
| 2016 | $4,732 | $243,300 | $164,600 | $78,700 |
| 2015 | $4,786 | $243,300 | $164,600 | $78,700 |
| 2014 | $4,632 | $243,300 | $164,600 | $78,700 |
Source: Public Records
Map
Nearby Homes
- 20 Courier Place
- 33 Hasbrouck Place
- 99 Morse Ave
- 15 Morrissee Ave
- 56 Carmita Ave
- 58 Mozart St
- 88 Montross Ave
- 85 Beckwith Place
- 62 Johnson Ave
- 237 Washington Ave
- 11 Roehrs Dr
- 29 Mount Pleasant Ave
- 409 Washington St
- 271 W Erie Ave
- 126 Hackett Place Unit 101A
- 47 Vanderburgh Ave
- 327 Madison St
- 592 Central Ave
- 32 Wingra Ave
- 507 Washington St
- 43 Willow Wood Square Unit 43
- 22 Willow Wood Square
- 44 Willow Wood Square Unit 2
- 44 Willow Wood Square Unit 1
- 44 Willow Wood Square
- 21 Willow Wood Square Unit C0021
- 23 Willow Wood Square
- 20 Willow Wood Square
- 41 Willow Wood Ct
- 24 Willow Wood Square
- 19 Willow Wood Square
- 40 Willow Wood Square Unit 2
- 29 Willow Wood Square Unit 29
- 25 Willow Wood Square Unit COO25
- 18 Willow Wood Square
- 39 Willow Wood Square
- 31 Willow Wood Square
- 26 Willow Wood Square
- 17 Willow Wood Square
- 33 Willow Wood Square