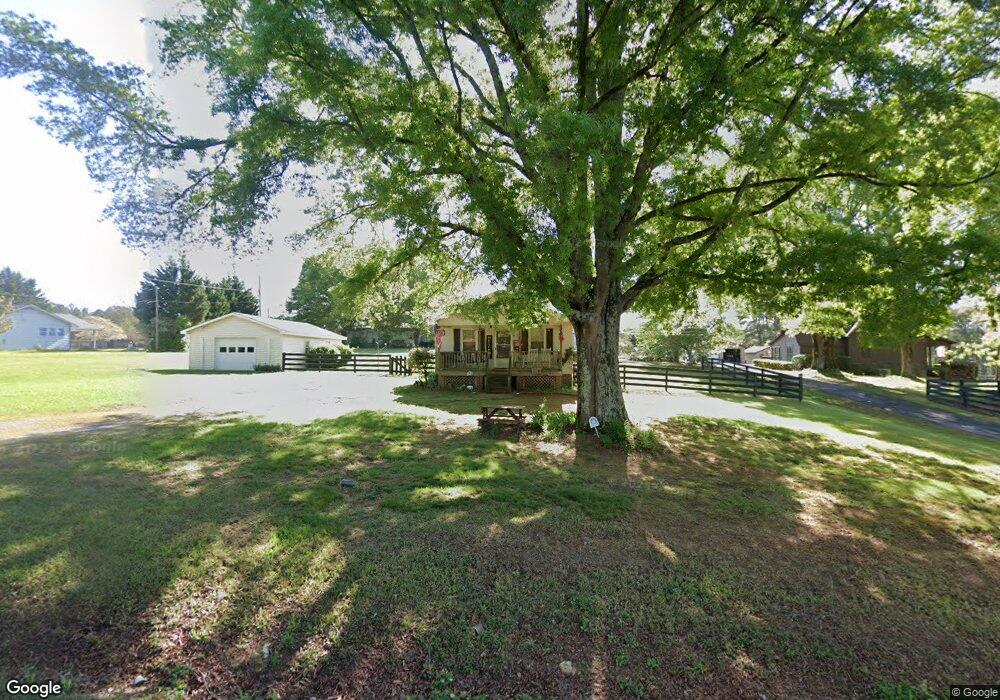
22 Wimberly Hill Rd Cedartown, GA 30125
Estimated Value: $171,000 - $272,000
3
Beds
2
Baths
1,104
Sq Ft
$184/Sq Ft
Est. Value
About This Home
This home is located at 22 Wimberly Hill Rd, Cedartown, GA 30125 and is currently estimated at $202,636, approximately $183 per square foot. 22 Wimberly Hill Rd is a home located in Polk County.
Ownership History
Date
Name
Owned For
Owner Type
Purchase Details
Closed on
Jan 20, 2004
Sold by
Johnson Jacqueline W Fka Jacqueline W
Bought by
Johnson John David*
Current Estimated Value
Purchase Details
Closed on
Oct 28, 1999
Sold by
Lucas James A
Bought by
Lucas Jacqueline W
Purchase Details
Closed on
Jun 25, 1999
Sold by
Lucas Bobby J
Bought by
Lucas James A
Purchase Details
Closed on
Oct 25, 1990
Sold by
Addison Mark G and Addison Amy
Bought by
Lucas Bobby J
Purchase Details
Closed on
Jun 12, 1986
Sold by
Willingham Donald F
Bought by
Addison Mark G and Addison Amy
Purchase Details
Closed on
Dec 16, 1982
Sold by
Dingler Larry and Dingler Judy
Bought by
Willingham Donald F
Purchase Details
Closed on
Jul 27, 1973
Sold by
Davis Larry G
Bought by
Dingler Larry and Dingler Judy
Purchase Details
Closed on
Dec 30, 1966
Sold by
Jones Albert F
Bought by
Davis Larry G
Purchase Details
Closed on
Jun 10, 1966
Sold by
Jones Beckie Mrs
Bought by
Jones Albert F
Purchase Details
Closed on
Feb 4, 1952
Bought by
Jones Beckie Mrs
Create a Home Valuation Report for This Property
The Home Valuation Report is an in-depth analysis detailing your home's value as well as a comparison with similar homes in the area
Home Values in the Area
Average Home Value in this Area
Purchase History
| Date | Buyer | Sale Price | Title Company |
|---|---|---|---|
| Johnson John David* | -- | -- | |
| Lucas Jacqueline W | -- | -- | |
| Lucas James A | -- | -- | |
| Lucas Bobby J | $35,000 | -- | |
| Addison Mark G | -- | -- | |
| Willingham Donald F | -- | -- | |
| Dingler Larry | -- | -- | |
| Davis Larry G | -- | -- | |
| Jones Albert F | -- | -- | |
| Jones Beckie Mrs | -- | -- |
Source: Public Records
Tax History Compared to Growth
Tax History
| Year | Tax Paid | Tax Assessment Tax Assessment Total Assessment is a certain percentage of the fair market value that is determined by local assessors to be the total taxable value of land and additions on the property. | Land | Improvement |
|---|---|---|---|---|
| 2024 | $974 | $46,572 | $2,271 | $44,301 |
| 2023 | $734 | $30,923 | $2,271 | $28,652 |
| 2022 | $623 | $26,247 | $1,514 | $24,733 |
| 2021 | $631 | $26,247 | $1,514 | $24,733 |
| 2020 | $632 | $26,247 | $1,514 | $24,733 |
| 2019 | $746 | $27,772 | $1,514 | $26,258 |
| 2018 | $744 | $27,006 | $1,514 | $25,492 |
| 2017 | $737 | $27,080 | $1,588 | $25,492 |
| 2016 | $732 | $26,898 | $1,406 | $25,492 |
| 2015 | $779 | $28,533 | $1,406 | $27,128 |
| 2014 | $784 | $28,533 | $1,406 | $27,128 |
Source: Public Records
Map
Nearby Homes
- 94 Wimberly Hill Loop
- 3323 Rockmart Hwy
- 536 Wimberly Hill Rd
- 247 Grady Rd
- 200 Kelly Rd
- 600 Grady Rd
- 387 Lindsey Chapel Rd
- 0 Richard Pullen Rd Unit 10577442
- 0 Richard Pullen Rd Unit 7626794
- 728 Hutto Rd
- 0 Benefield Rd Unit 7479734
- 0 Benefield Rd Unit 10405501
- 2705 Collard Valley Rd
- 394 Knight Rd
- 470 Knight Rd
- 2020 Old Cedartown Rd
- 256 Cuzzort Rd
- 0 Pine Mountain Rd Unit 7662185
- 0 Pine Mountain Rd Unit 10478395
- 0 Pine Mountain Rd Unit 7540784
- 10 Wimberly Hill Rd
- 0 Wimberly Hill Rd Unit 7314581
- 0 Wimberly Hill Rd Unit 8193137
- 0 Wimberly Hill Rd Unit 5852662
- 0 Wimberly Hill Rd Unit 7486429
- 0 Wimberly Hill Rd Unit 7614471
- 0 Wimberly Hill Rd Unit 8239537
- 7 Wimberly Hill Rd
- 42 Wimberly Hill Rd
- 21 Wimberly Hill Rd
- 45 Wimberly Hill Rd
- 70 Wimberly Hill Rd
- 2959 Rockmart Hwy
- 63 Wimberly Hill Rd
- 155 Wimberly Hill Loop
- 77 Wimberly Hill Rd
- 134 Wimberly Hill Rd
- 117 Wimberly Hill Rd
- 0 Wimberly Hill Loop
- 146 Wimberly Hill Rd