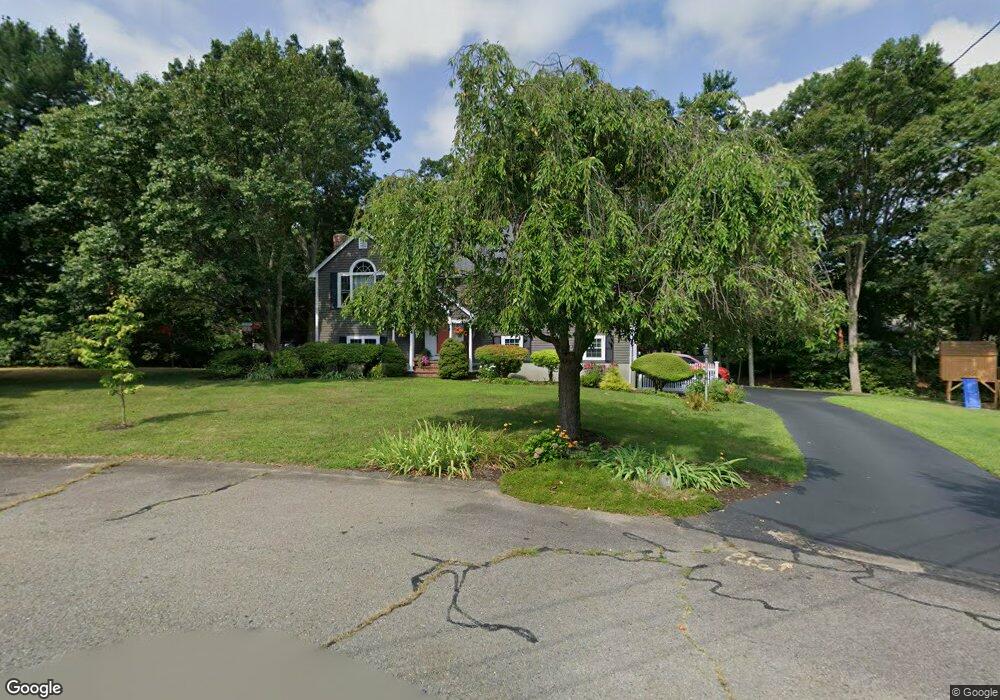
22 Winchester Cir North Attleboro, MA 02760
North Attleboro NeighborhoodEstimated Value: $642,748 - $768,000
2
Beds
3
Baths
1,408
Sq Ft
$482/Sq Ft
Est. Value
About This Home
This home is located at 22 Winchester Cir, North Attleboro, MA 02760 and is currently estimated at $678,937, approximately $482 per square foot. 22 Winchester Cir is a home located in Bristol County with nearby schools including North Attleboro High School, Cadence Academy Preschool - North Attleborough, and Bishop Feehan High School.
Ownership History
Date
Name
Owned For
Owner Type
Purchase Details
Closed on
Apr 29, 1996
Sold by
Brennan Isabel E
Bought by
Vanburen Michael T and Vanburen Margaret O
Current Estimated Value
Home Financials for this Owner
Home Financials are based on the most recent Mortgage that was taken out on this home.
Original Mortgage
$130,000
Interest Rate
7.81%
Mortgage Type
Purchase Money Mortgage
Create a Home Valuation Report for This Property
The Home Valuation Report is an in-depth analysis detailing your home's value as well as a comparison with similar homes in the area
Home Values in the Area
Average Home Value in this Area
Purchase History
| Date | Buyer | Sale Price | Title Company |
|---|---|---|---|
| Vanburen Michael T | $185,000 | -- |
Source: Public Records
Mortgage History
| Date | Status | Borrower | Loan Amount |
|---|---|---|---|
| Open | Vanburen Michael T | $102,650 | |
| Closed | Vanburen Michael T | $130,000 |
Source: Public Records
Tax History Compared to Growth
Tax History
| Year | Tax Paid | Tax Assessment Tax Assessment Total Assessment is a certain percentage of the fair market value that is determined by local assessors to be the total taxable value of land and additions on the property. | Land | Improvement |
|---|---|---|---|---|
| 2025 | $6,696 | $567,900 | $157,000 | $410,900 |
| 2024 | $6,390 | $553,700 | $157,000 | $396,700 |
| 2023 | $7,069 | $552,700 | $163,900 | $388,800 |
| 2022 | $6,654 | $477,700 | $157,000 | $320,700 |
| 2021 | $6,410 | $449,200 | $157,000 | $292,200 |
| 2020 | $6,216 | $433,200 | $157,000 | $276,200 |
| 2019 | $6,014 | $422,300 | $142,800 | $279,500 |
| 2018 | $5,325 | $399,200 | $142,800 | $256,400 |
| 2017 | $5,063 | $383,000 | $142,800 | $240,200 |
| 2016 | $4,938 | $373,500 | $165,600 | $207,900 |
| 2015 | $4,665 | $355,000 | $172,500 | $182,500 |
| 2014 | $4,327 | $326,800 | $151,300 | $175,500 |
Source: Public Records
Map
Nearby Homes
- 10 Sleepy Hollow Cir
- 11 Landry Ave
- 16 Raymond Hall Dr
- 116 George St
- 15 Old Wood Rd
- 57 Vine St
- Lot 5 Jeffrey Dr
- Lot 2 Jeffrey Dr
- 115 Westfield Dr
- 17 Peters Way
- 36 Cranberry Rd
- 28 Messenger St
- 2 George St Unit C
- 1730 West St
- 12 Houde St
- 122 Mary Ann Way
- 33 Dublin Way
- 166 E Bacon St Unit 4
- 47 Old Farm Rd
- 3 Serengeti Dr