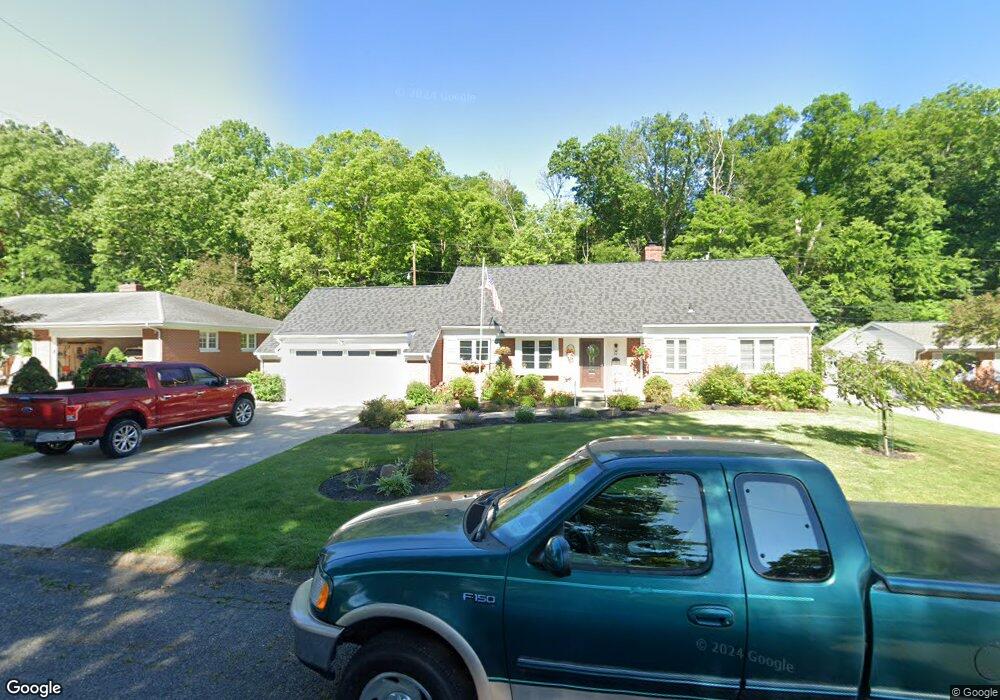
22 Woodbriar Dr Chillicothe, OH 45601
Estimated Value: $338,000 - $388,000
4
Beds
3
Baths
2,877
Sq Ft
$123/Sq Ft
Est. Value
About This Home
This home is located at 22 Woodbriar Dr, Chillicothe, OH 45601 and is currently estimated at $354,369, approximately $123 per square foot. 22 Woodbriar Dr is a home located in Ross County with nearby schools including Chillicothe High School, Bishop Flaget School, and Wesley Taylor Preparatory School.
Ownership History
Date
Name
Owned For
Owner Type
Purchase Details
Closed on
Apr 16, 2018
Sold by
Gray Gerald D and Toth Suzanne E
Bought by
Gray Gerald D and Gerald D Gray Revocable Living
Current Estimated Value
Home Financials for this Owner
Home Financials are based on the most recent Mortgage that was taken out on this home.
Original Mortgage
$15,000
Outstanding Balance
$12,897
Interest Rate
4.43%
Mortgage Type
Purchase Money Mortgage
Estimated Equity
$341,472
Purchase Details
Closed on
Sep 25, 2015
Sold by
Thornton Stephen R and Thornton Craig O
Bought by
Gray Gerald D and Totht Suzanne E
Home Financials for this Owner
Home Financials are based on the most recent Mortgage that was taken out on this home.
Original Mortgage
$175,750
Outstanding Balance
$138,419
Interest Rate
3.91%
Mortgage Type
New Conventional
Estimated Equity
$215,950
Purchase Details
Closed on
Mar 28, 2012
Sold by
Thornton Robert R
Bought by
Thornton Stephen R and Thornton Craig O
Create a Home Valuation Report for This Property
The Home Valuation Report is an in-depth analysis detailing your home's value as well as a comparison with similar homes in the area
Home Values in the Area
Average Home Value in this Area
Purchase History
| Date | Buyer | Sale Price | Title Company |
|---|---|---|---|
| Gray Gerald D | -- | None Available | |
| Gray Gerald D | $185,000 | Arrow Title | |
| Thornton Stephen R | -- | None Available |
Source: Public Records
Mortgage History
| Date | Status | Borrower | Loan Amount |
|---|---|---|---|
| Open | Gray Gerald D | $15,000 | |
| Open | Gray Gerald D | $175,750 |
Source: Public Records
Tax History Compared to Growth
Tax History
| Year | Tax Paid | Tax Assessment Tax Assessment Total Assessment is a certain percentage of the fair market value that is determined by local assessors to be the total taxable value of land and additions on the property. | Land | Improvement |
|---|---|---|---|---|
| 2024 | $4,265 | $107,010 | $16,120 | $90,890 |
| 2023 | $4,265 | $107,010 | $16,120 | $90,890 |
| 2022 | $4,342 | $107,010 | $16,120 | $90,890 |
| 2021 | $3,690 | $79,710 | $12,500 | $67,210 |
| 2020 | $3,689 | $79,710 | $12,500 | $67,210 |
| 2019 | $3,692 | $79,710 | $12,500 | $67,210 |
| 2018 | $3,558 | $72,780 | $12,500 | $60,280 |
| 2017 | $3,830 | $72,780 | $12,500 | $60,280 |
| 2016 | $3,793 | $72,780 | $12,500 | $60,280 |
| 2015 | $3,798 | $69,400 | $12,500 | $56,900 |
| 2014 | $3,726 | $69,400 | $12,500 | $56,900 |
| 2013 | $3,730 | $69,400 | $12,500 | $56,900 |
Source: Public Records
Map
Nearby Homes
- 2 Marlboro Dr
- 662 Laurel St
- 637 Linn St
- 625 Oneida Rd
- 15 Windsor Dr
- 9 Kensington Dr
- 7 Kensington Dr
- 5 Kensington Dr
- 30 Fruit Hill Dr
- 14 Fruit Hill Dr
- 6 Mcintosh Ct
- 87 Limestone Blvd
- 59 Limestone Blvd
- 312 Constitution Dr
- 304 Constitution Dr
- 286 Constitution Dr
- 228 Locust St
- 23 Shawnee Dr
- 14996 Pleasant Valley Rd Unit Lot 53
- 14996 Pleasant Valley Rd Unit Lot 60
- 18 Woodbriar Dr
- 26 Woodbriar Dr
- 14 Woodbriar Dr
- 19 Woodbriar Dr
- 30 Woodbriar Dr
- 23 Woodbriar Dr
- 10 Woodbriar Dr
- 27 Woodbriar Dr
- 11 Woodbriar Dr
- 769 Ashley Dr
- 6 Woodbriar Dr
- 3 Woodbriar Dr
- 745 Ashley Dr
- 770 Ashley Dr
- 2 Woodbriar Dr
- 2 Yaples Orchard Dr
- 750 Ashley Dr
- 725 Ashley Dr
- 715 Allen Ave
- 721 Allen Ave