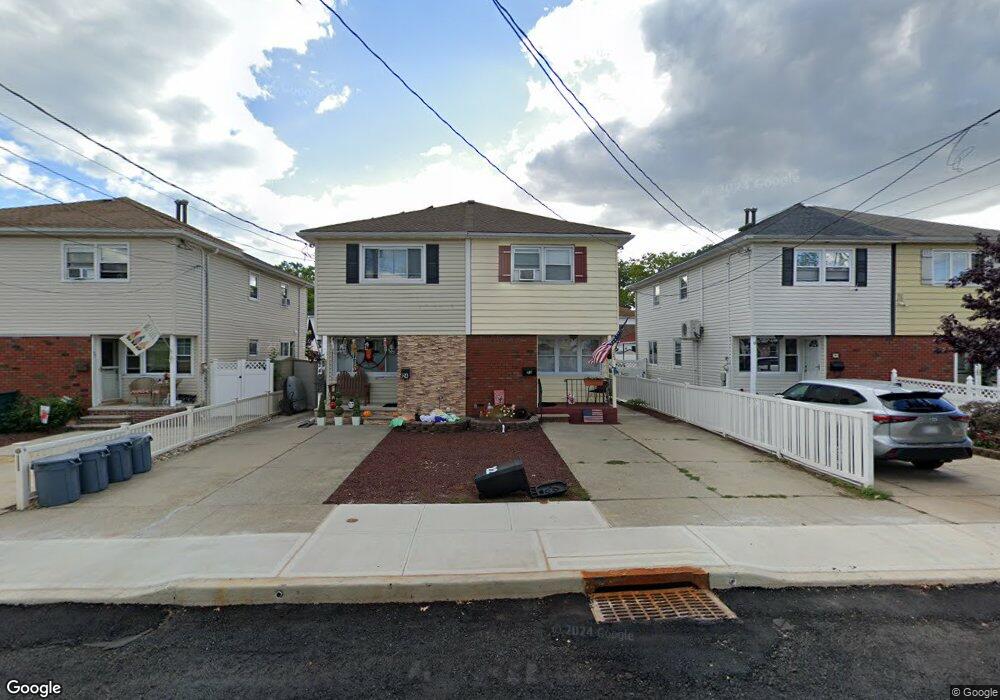
22 Xenia St Staten Island, NY 10305
Dongan Hills NeighborhoodEstimated Value: $662,646 - $755,000
3
Beds
2
Baths
1,108
Sq Ft
$637/Sq Ft
Est. Value
About This Home
This home is located at 22 Xenia St, Staten Island, NY 10305 and is currently estimated at $705,662, approximately $636 per square foot. 22 Xenia St is a home located in Richmond County with nearby schools including P.S. 052 John C. Thompson, Is 2 George L Egbert, and New Dorp High School.
Ownership History
Date
Name
Owned For
Owner Type
Purchase Details
Closed on
Aug 17, 2005
Sold by
Lane James and Lane Marion
Bought by
Donnelly Angela and Minucci Angelina
Current Estimated Value
Home Financials for this Owner
Home Financials are based on the most recent Mortgage that was taken out on this home.
Original Mortgage
$324,000
Interest Rate
6.07%
Mortgage Type
Fannie Mae Freddie Mac
Purchase Details
Closed on
Aug 10, 1998
Sold by
Antonovich Philip and Antonovich Valerie
Bought by
Lane James and Jackson Marion
Home Financials for this Owner
Home Financials are based on the most recent Mortgage that was taken out on this home.
Original Mortgage
$156,000
Interest Rate
6.9%
Create a Home Valuation Report for This Property
The Home Valuation Report is an in-depth analysis detailing your home's value as well as a comparison with similar homes in the area
Home Values in the Area
Average Home Value in this Area
Purchase History
| Date | Buyer | Sale Price | Title Company |
|---|---|---|---|
| Donnelly Angela | $405,000 | First American Title Ins Co | |
| Lane James | $161,000 | -- |
Source: Public Records
Mortgage History
| Date | Status | Borrower | Loan Amount |
|---|---|---|---|
| Previous Owner | Donnelly Angela | $324,000 | |
| Previous Owner | Lane James | $156,000 |
Source: Public Records
Tax History Compared to Growth
Tax History
| Year | Tax Paid | Tax Assessment Tax Assessment Total Assessment is a certain percentage of the fair market value that is determined by local assessors to be the total taxable value of land and additions on the property. | Land | Improvement |
|---|---|---|---|---|
| 2025 | $4,317 | $37,920 | $4,202 | $33,718 |
| 2024 | $4,330 | $37,620 | $4,236 | $33,384 |
| 2023 | $4,330 | $22,723 | $3,994 | $18,729 |
| 2022 | $3,993 | $34,800 | $6,960 | $27,840 |
| 2021 | $3,953 | $33,180 | $6,960 | $26,220 |
| 2020 | $3,743 | $32,280 | $6,960 | $25,320 |
| 2019 | $3,698 | $28,920 | $6,960 | $21,960 |
| 2018 | $3,562 | $18,936 | $5,267 | $13,669 |
| 2017 | $3,342 | $17,865 | $5,468 | $12,397 |
| 2016 | $3,059 | $16,854 | $6,327 | $10,527 |
| 2015 | $2,746 | $15,900 | $5,820 | $10,080 |
| 2014 | $2,746 | $15,900 | $5,820 | $10,080 |
Source: Public Records
Map
Nearby Homes
- 125 Laconia Ave
- 139 Hurlbert St
- 206 Benton Ave
- 71 Cameron Ave
- 275 Hurlbert St
- 12 Mcdermott Ave
- 57 Jerome Rd
- 115 W Broadway Unit 4
- 74 Appleby Ave
- 381 Burgher Ave
- 44 Quintard St
- 141 Evergreen Ave Unit 2a
- 12 Reid Ave
- 220 Norway Ave
- 4 Mccormick Place
- 200 Mallory Ave
- 236 Mallory Ave
- 84 Winfield St
- 504 Mcclean Ave
- 286 Raritan Ave