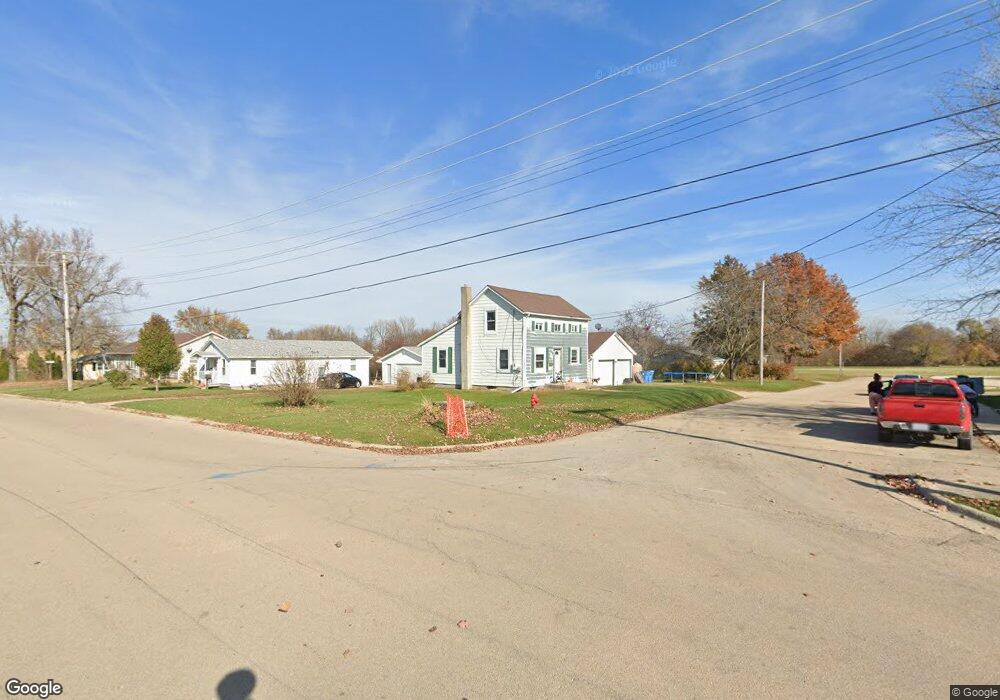
220 18th St Mendota, IL 61342
Estimated Value: $101,000 - $128,000
3
Beds
1
Bath
1,125
Sq Ft
$99/Sq Ft
Est. Value
About This Home
This home is located at 220 18th St, Mendota, IL 61342 and is currently estimated at $111,142, approximately $98 per square foot. 220 18th St is a home located in LaSalle County with nearby schools including Northbrook School, Lincoln Elementary School, and Blackstone Elementary School.
Ownership History
Date
Name
Owned For
Owner Type
Purchase Details
Closed on
Feb 12, 2025
Sold by
Arteaga Jose Dejesus
Bought by
Arteaga Jose Dejesus and Arteaga Ana Belia
Current Estimated Value
Purchase Details
Closed on
Nov 18, 2011
Sold by
Dearteayr Jose De and Arteayr Ana B
Bought by
Artoayr Jose and Artoayr Ana
Purchase Details
Closed on
Jul 30, 2011
Sold by
Arteaga Anthony N and Arteaga Liliana
Bought by
Household Finance Corporation Iii
Create a Home Valuation Report for This Property
The Home Valuation Report is an in-depth analysis detailing your home's value as well as a comparison with similar homes in the area
Home Values in the Area
Average Home Value in this Area
Purchase History
| Date | Buyer | Sale Price | Title Company |
|---|---|---|---|
| Arteaga Jose Dejesus | -- | None Available | |
| Artoayr Jose | -- | None Available | |
| Household Finance Corporation Iii | -- | None Available |
Source: Public Records
Mortgage History
| Date | Status | Borrower | Loan Amount |
|---|---|---|---|
| Closed | Artoayr Jose | $0 |
Source: Public Records
Tax History
| Year | Tax Paid | Tax Assessment Tax Assessment Total Assessment is a certain percentage of the fair market value that is determined by local assessors to be the total taxable value of land and additions on the property. | Land | Improvement |
|---|---|---|---|---|
| 2024 | $1,776 | $20,503 | $3,848 | $16,655 |
| 2023 | $1,702 | $19,094 | $3,584 | $15,510 |
| 2022 | $1,574 | $17,407 | $3,267 | $14,140 |
| 2021 | $1,567 | $16,478 | $3,093 | $13,385 |
| 2020 | $1,474 | $15,558 | $2,920 | $12,638 |
| 2019 | $1,495 | $15,558 | $2,920 | $12,638 |
| 2018 | $1,512 | $15,217 | $2,856 | $12,361 |
| 2017 | $1,520 | $15,025 | $2,820 | $12,205 |
| 2016 | $1,469 | $14,385 | $2,700 | $11,685 |
| 2015 | $1,445 | $14,081 | $2,618 | $11,463 |
| 2012 | -- | $16,128 | $2,999 | $13,129 |
Source: Public Records
Map
Nearby Homes
Your Personal Tour Guide
Ask me questions while you tour the home.