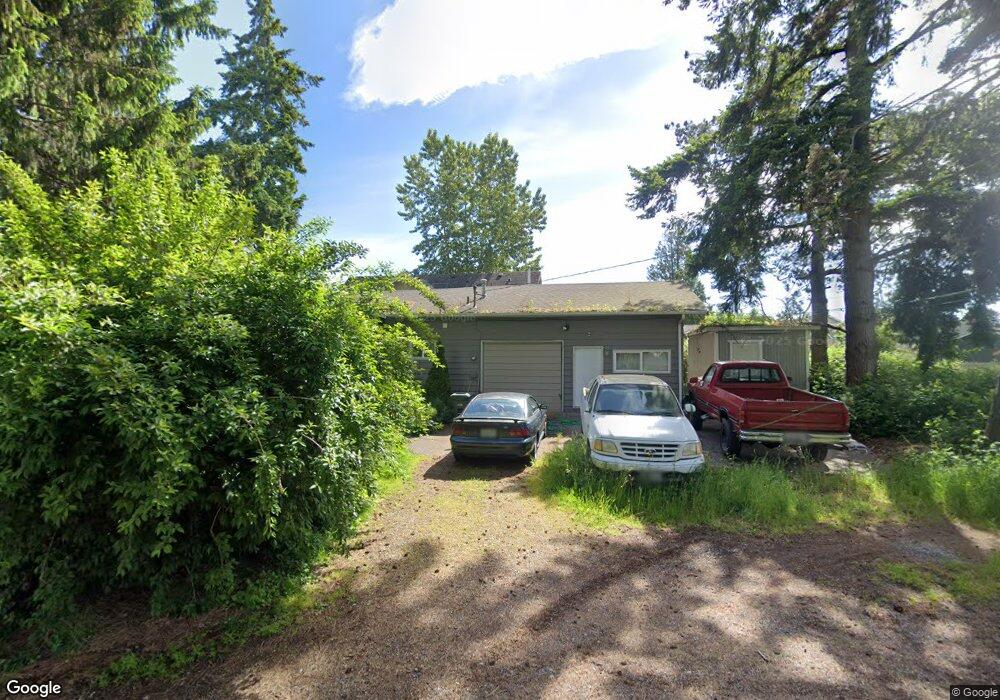
220 5th St Blaine, WA 98230
Estimated Value: $425,736 - $466,000
2
Beds
2
Baths
1,342
Sq Ft
$326/Sq Ft
Est. Value
About This Home
This home is located at 220 5th St, Blaine, WA 98230 and is currently estimated at $437,934, approximately $326 per square foot. 220 5th St is a home located in Whatcom County with nearby schools including Blaine Primary School, Blaine Elementary School, and Blaine Middle School.
Ownership History
Date
Name
Owned For
Owner Type
Purchase Details
Closed on
Nov 7, 2019
Sold by
Dhillon Preetpal K and Dhillon Jaswinder S
Bought by
Dhillon Justin S
Current Estimated Value
Home Financials for this Owner
Home Financials are based on the most recent Mortgage that was taken out on this home.
Original Mortgage
$240,000
Outstanding Balance
$211,138
Interest Rate
3.6%
Mortgage Type
New Conventional
Estimated Equity
$226,796
Purchase Details
Closed on
May 18, 2004
Sold by
Jaffer Ameerali G and Jaffer Munira
Bought by
Dhillon Jaswinder S and Dhillon Preetpal K
Home Financials for this Owner
Home Financials are based on the most recent Mortgage that was taken out on this home.
Original Mortgage
$104,000
Interest Rate
5.86%
Mortgage Type
Purchase Money Mortgage
Create a Home Valuation Report for This Property
The Home Valuation Report is an in-depth analysis detailing your home's value as well as a comparison with similar homes in the area
Home Values in the Area
Average Home Value in this Area
Purchase History
| Date | Buyer | Sale Price | Title Company |
|---|---|---|---|
| Dhillon Justin S | $300,000 | Whatcom Land Title Co Inc | |
| Dhillon Jaswinder S | $130,000 | First American Title Insuran |
Source: Public Records
Mortgage History
| Date | Status | Borrower | Loan Amount |
|---|---|---|---|
| Open | Dhillon Justin S | $240,000 | |
| Previous Owner | Dhillon Jaswinder S | $104,000 | |
| Closed | Dhillon Jaswinder S | $26,000 |
Source: Public Records
Tax History Compared to Growth
Tax History
| Year | Tax Paid | Tax Assessment Tax Assessment Total Assessment is a certain percentage of the fair market value that is determined by local assessors to be the total taxable value of land and additions on the property. | Land | Improvement |
|---|---|---|---|---|
| 2024 | $2,456 | $364,547 | $133,200 | $231,347 |
| 2023 | $2,456 | $364,547 | $133,200 | $231,347 |
| 2022 | $2,158 | $328,421 | $120,000 | $208,421 |
| 2021 | $2,058 | $247,264 | $99,084 | $148,180 |
| 2020 | $1,958 | $215,012 | $86,160 | $128,852 |
| 2019 | $1,824 | $196,895 | $78,900 | $117,995 |
| 2018 | $1,695 | $178,927 | $71,700 | $107,227 |
| 2017 | $1,511 | $149,730 | $60,000 | $89,730 |
| 2016 | $1,330 | $149,730 | $60,000 | $89,730 |
| 2015 | $1,303 | $127,129 | $44,163 | $82,966 |
| 2014 | -- | $121,659 | $42,262 | $79,397 |
| 2013 | -- | $120,332 | $41,800 | $78,532 |
Source: Public Records
Map
Nearby Homes