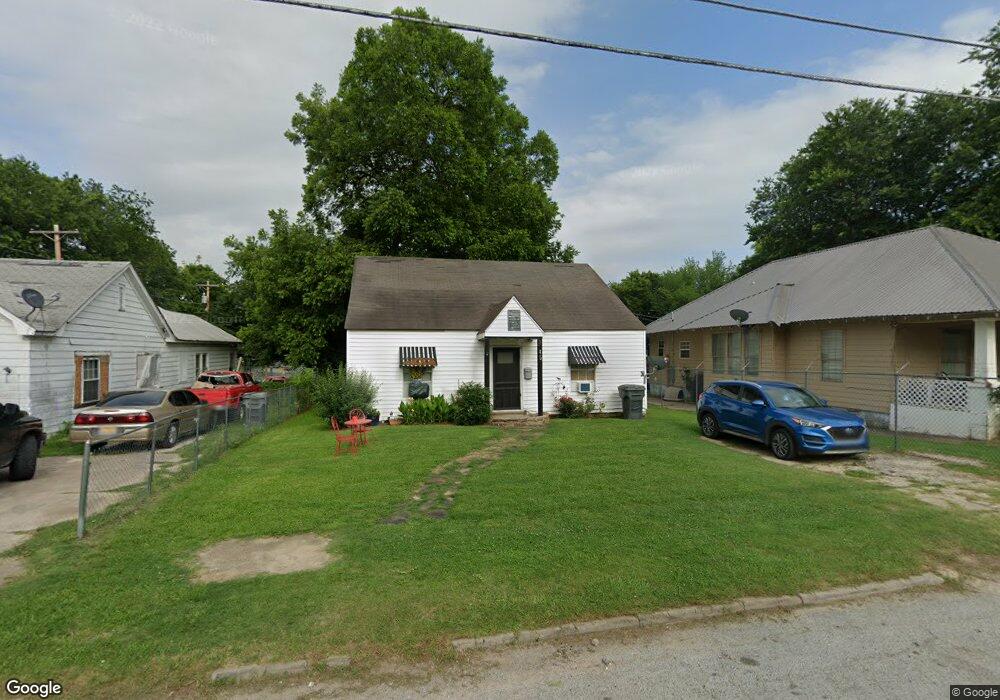
220 B St SW Ardmore, OK 73401
Estimated Value: $119,000 - $205,000
3
Beds
1
Bath
1,485
Sq Ft
$106/Sq Ft
Est. Value
About This Home
This home is located at 220 B St SW, Ardmore, OK 73401 and is currently estimated at $157,194, approximately $105 per square foot. 220 B St SW is a home located in Carter County with nearby schools including Lincoln Elementary School, Ardmore Middle School, and Ardmore High School.
Ownership History
Date
Name
Owned For
Owner Type
Purchase Details
Closed on
Sep 5, 2022
Sold by
Fel Investment Llc
Bought by
Rpg Properties Llc
Current Estimated Value
Home Financials for this Owner
Home Financials are based on the most recent Mortgage that was taken out on this home.
Original Mortgage
$205,690
Outstanding Balance
$175,000
Interest Rate
4.58%
Mortgage Type
New Conventional
Estimated Equity
-$17,806
Purchase Details
Closed on
Sep 4, 2020
Sold by
Griffith Judy Ann and Judy Ann Griffith Family Trust
Bought by
Fel Investments Llc and Fel Investment Llc
Create a Home Valuation Report for This Property
The Home Valuation Report is an in-depth analysis detailing your home's value as well as a comparison with similar homes in the area
Home Values in the Area
Average Home Value in this Area
Purchase History
| Date | Buyer | Sale Price | Title Company |
|---|---|---|---|
| Rpg Properties Llc | $250,000 | -- | |
| Fel Investments Llc | $80,000 | Stewart Title Guaranty Co |
Source: Public Records
Mortgage History
| Date | Status | Borrower | Loan Amount |
|---|---|---|---|
| Open | Rpg Properties Llc | $205,690 |
Source: Public Records
Tax History Compared to Growth
Tax History
| Year | Tax Paid | Tax Assessment Tax Assessment Total Assessment is a certain percentage of the fair market value that is determined by local assessors to be the total taxable value of land and additions on the property. | Land | Improvement |
|---|---|---|---|---|
| 2024 | $1,219 | $12,339 | $1,800 | $10,539 |
| 2023 | $1,161 | $11,752 | $1,800 | $9,952 |
| 2022 | $913 | $9,545 | $1,800 | $7,745 |
| 2021 | $917 | $9,091 | $1,800 | $7,291 |
| 2020 | $407 | $4,091 | $505 | $3,586 |
| 2019 | $378 | $3,896 | $481 | $3,415 |
| 2018 | $366 | $3,711 | $458 | $3,253 |
| 2017 | $323 | $3,534 | $436 | $3,098 |
| 2016 | $314 | $3,366 | $541 | $2,825 |
| 2015 | $246 | $3,205 | $285 | $2,920 |
| 2014 | $235 | $3,053 | $285 | $2,768 |
Source: Public Records
Map
Nearby Homes