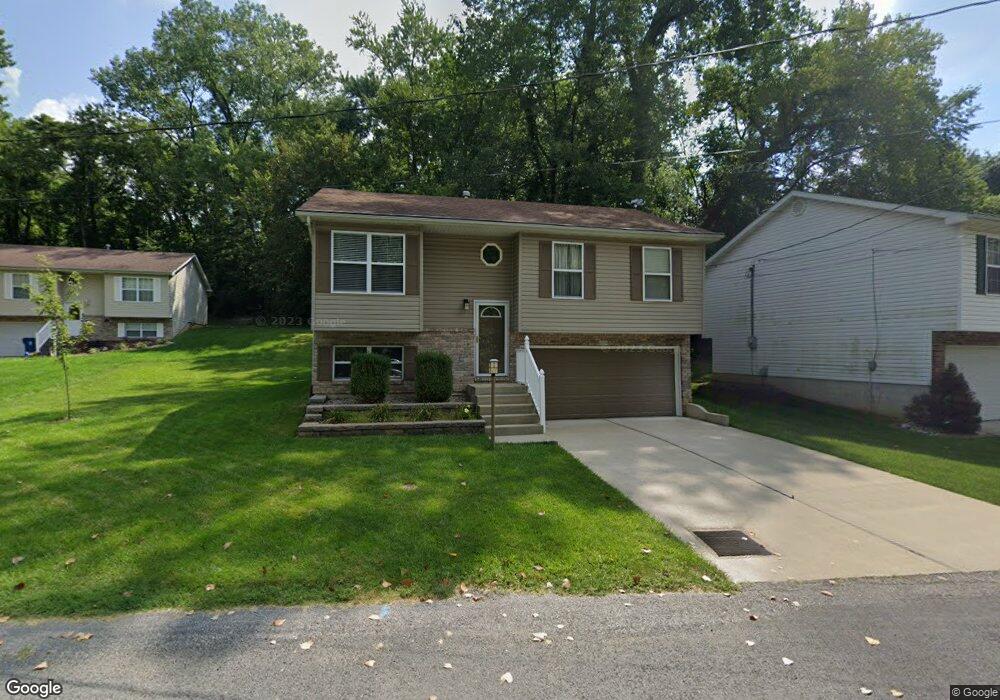
220 Branch St Collinsville, IL 62234
Estimated Value: $193,104 - $247,000
3
Beds
4
Baths
858
Sq Ft
$252/Sq Ft
Est. Value
About This Home
This home is located at 220 Branch St, Collinsville, IL 62234 and is currently estimated at $216,026, approximately $251 per square foot. 220 Branch St is a home located in Madison County with nearby schools including John A Renfro Elementary School, Dorris Intermediate School, and Collinsville Middle School.
Ownership History
Date
Name
Owned For
Owner Type
Purchase Details
Closed on
Sep 7, 2017
Sold by
Swinford Matthew A
Bought by
Swinford Trust
Current Estimated Value
Purchase Details
Closed on
Jun 13, 2011
Sold by
Swinford Matthew A
Bought by
The Matthew A Swinford Trust
Purchase Details
Closed on
Jul 30, 2004
Sold by
Mcnally Jim F and Mcnally Karen L
Bought by
Swinford Matthew A
Home Financials for this Owner
Home Financials are based on the most recent Mortgage that was taken out on this home.
Original Mortgage
$106,000
Interest Rate
6.35%
Mortgage Type
Unknown
Purchase Details
Closed on
Apr 30, 2003
Sold by
Seiber James and Seiber Erma
Bought by
Mcnally Jim F and Mcnally Karen L
Purchase Details
Closed on
Apr 25, 2003
Sold by
Seiber James and Seiber Erma
Bought by
Mcnally Jim F and Mcnally Karen L
Create a Home Valuation Report for This Property
The Home Valuation Report is an in-depth analysis detailing your home's value as well as a comparison with similar homes in the area
Home Values in the Area
Average Home Value in this Area
Purchase History
| Date | Buyer | Sale Price | Title Company |
|---|---|---|---|
| Swinford Trust | -- | -- | |
| The Matthew A Swinford Trust | -- | None Available | |
| Swinford Matthew A | $132,500 | Abstracts & Titles Inc | |
| Mcnally Jim F | $22,500 | Abstracts & Titles Inc | |
| Mcnally Jim F | $22,500 | Abstracts & Titles Inc |
Source: Public Records
Mortgage History
| Date | Status | Borrower | Loan Amount |
|---|---|---|---|
| Previous Owner | Swinford Matthew A | $106,000 | |
| Closed | Swinford Matthew A | $26,500 |
Source: Public Records
Tax History Compared to Growth
Tax History
| Year | Tax Paid | Tax Assessment Tax Assessment Total Assessment is a certain percentage of the fair market value that is determined by local assessors to be the total taxable value of land and additions on the property. | Land | Improvement |
|---|---|---|---|---|
| 2024 | $2,696 | $48,170 | $4,780 | $43,390 |
| 2023 | $2,696 | $44,580 | $4,420 | $40,160 |
| 2022 | $2,539 | $40,060 | $3,960 | $36,100 |
| 2021 | $2,186 | $37,640 | $3,720 | $33,920 |
| 2020 | $2,088 | $35,910 | $3,550 | $32,360 |
| 2019 | $2,018 | $34,680 | $3,430 | $31,250 |
| 2018 | $2,282 | $37,290 | $3,570 | $33,720 |
| 2017 | $2,275 | $36,550 | $3,500 | $33,050 |
| 2016 | $2,387 | $36,550 | $3,500 | $33,050 |
| 2015 | $2,216 | $35,600 | $3,410 | $32,190 |
| 2014 | $2,216 | $35,600 | $3,410 | $32,190 |
| 2013 | $2,216 | $35,600 | $3,410 | $32,190 |
Source: Public Records
Map
Nearby Homes
- 1104 State St
- 892 Lester Ave
- 921 Prospect St
- 919 Vine St
- 6430 Lebanon Rd
- 1227 Ridge Ave
- 501 Spring
- 1301 Gladys St
- 1002 California Ave
- 1322 Leland St
- 238 Mill St
- 1210 Constance St
- 1120 Williams St
- 308 Brown Ave
- 6506 Timber Lake Dr
- 404 E Church St
- 216 S Chestnut St
- 617 N Morrison Ave
- 300 Pine Lake Rd Unit 6
- 300 Pine Lake Rd Unit 7
- 218 Branch St
- 222 Branch St
- 216 Branch St
- 212 Branch St
- 214 Branch St
- 234 Mulberry St
- 216 Mulberry St
- 216 Mulberry St
- 235 Mulberry St
- 1405 Lebanon Rd
- 231 Mulberry St
- 227 Mulberry St
- 214 Mulberry St
- 204 Branch St
- 704 Oak Trail Unit 706
- 702 Oak Trail
- 698 Oak Trail
- 696 Oak Trail
- 694 Oak Trail
- 202 Mulberry St