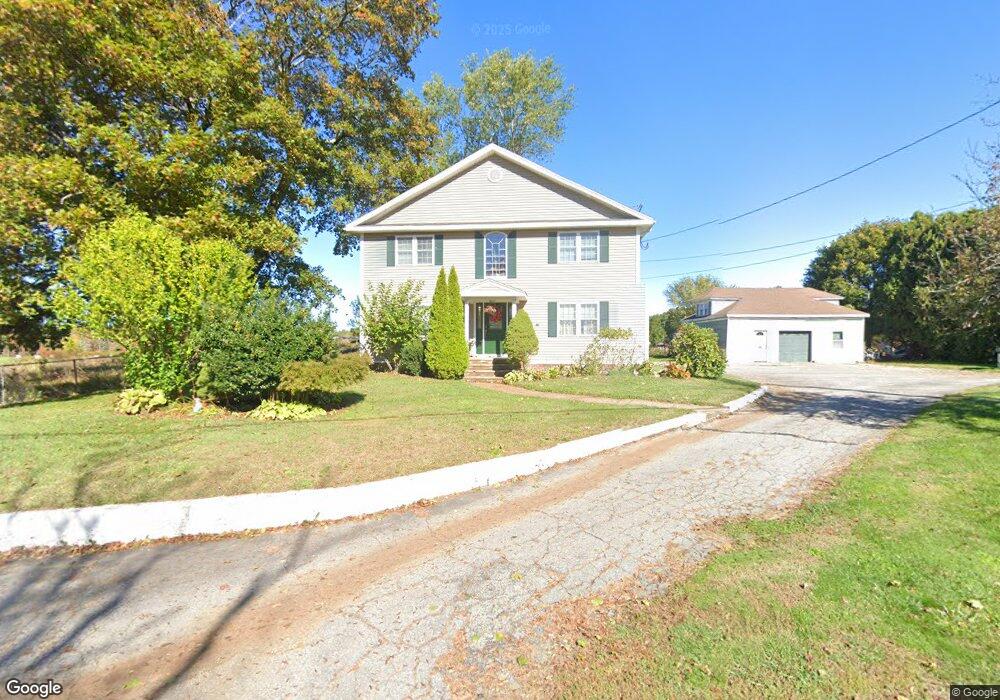
220 Brook St Rehoboth, MA 02769
Estimated Value: $557,000 - $796,000
3
Beds
2
Baths
2,416
Sq Ft
$270/Sq Ft
Est. Value
About This Home
This home is located at 220 Brook St, Rehoboth, MA 02769 and is currently estimated at $653,138, approximately $270 per square foot. 220 Brook St is a home located in Bristol County with nearby schools including Dighton-Rehoboth Regional High School.
Ownership History
Date
Name
Owned For
Owner Type
Purchase Details
Closed on
Apr 2, 2002
Sold by
Fernandes Maria A
Bought by
Custodio Salvador J and Custodio Maria A
Current Estimated Value
Home Financials for this Owner
Home Financials are based on the most recent Mortgage that was taken out on this home.
Original Mortgage
$160,000
Outstanding Balance
$66,659
Interest Rate
6.88%
Mortgage Type
Purchase Money Mortgage
Estimated Equity
$586,479
Create a Home Valuation Report for This Property
The Home Valuation Report is an in-depth analysis detailing your home's value as well as a comparison with similar homes in the area
Home Values in the Area
Average Home Value in this Area
Purchase History
| Date | Buyer | Sale Price | Title Company |
|---|---|---|---|
| Custodio Salvador J | $170,000 | -- |
Source: Public Records
Mortgage History
| Date | Status | Borrower | Loan Amount |
|---|---|---|---|
| Open | Custodio Salvador J | $160,000 |
Source: Public Records
Tax History
| Year | Tax Paid | Tax Assessment Tax Assessment Total Assessment is a certain percentage of the fair market value that is determined by local assessors to be the total taxable value of land and additions on the property. | Land | Improvement |
|---|---|---|---|---|
| 2025 | $53 | $476,500 | $193,700 | $282,800 |
| 2024 | $5,260 | $463,000 | $193,700 | $269,300 |
| 2023 | $4,938 | $426,400 | $189,700 | $236,700 |
| 2022 | $4,831 | $381,300 | $181,300 | $200,000 |
| 2021 | $4,617 | $348,700 | $165,000 | $183,700 |
| 2020 | $3,400 | $348,700 | $165,000 | $183,700 |
| 2018 | $0 | $324,600 | $157,200 | $167,400 |
| 2017 | $0 | $304,200 | $157,200 | $147,000 |
| 2016 | $3,696 | $304,200 | $157,200 | $147,000 |
| 2015 | $3,485 | $283,100 | $150,000 | $133,100 |
| 2014 | $3,432 | $275,900 | $142,800 | $133,100 |
Source: Public Records
Map
Nearby Homes
- 0 Winter St
- 205 Providence St Bldr Lot 3
- 203 Providence St Bldr Lot 5
- 197 Chestnut St
- 0 Wheaton Ave
- 67 Wheeler St
- 8 Linden Ln
- 8 Linden Ln
- 42 Linden Ln
- 20 School St
- 127 Mason St
- 111 Summer St
- 25 Columbine Rd
- 185 Moulton St
- 134 Mason St
- 17 Sassafras Rd
- 100 Bradley St
- 0 N Wheaton Ave
- 75 Martin St
- 67 Martin St
Your Personal Tour Guide
Ask me questions while you tour the home.