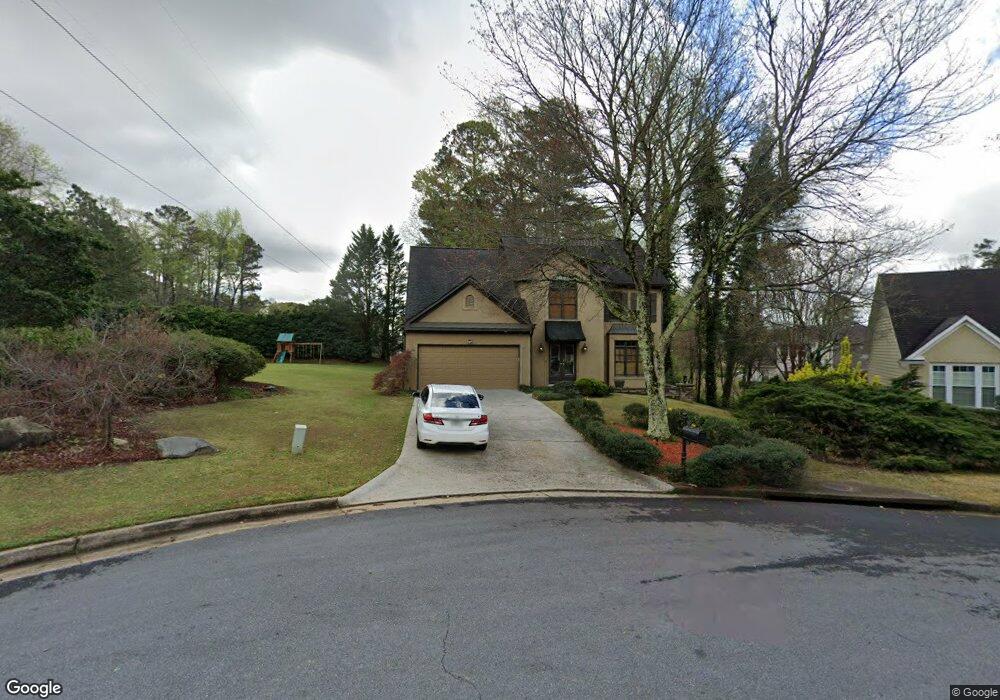
220 Brookhollow Trace Unit 1 Alpharetta, GA 30022
Estimated Value: $586,000 - $650,000
4
Beds
3
Baths
2,255
Sq Ft
$277/Sq Ft
Est. Value
About This Home
This home is located at 220 Brookhollow Trace Unit 1, Alpharetta, GA 30022 and is currently estimated at $623,830, approximately $276 per square foot. 220 Brookhollow Trace Unit 1 is a home located in Fulton County with nearby schools including Ocee Elementary School, Taylor Road Middle School, and Chattahoochee High School.
Ownership History
Date
Name
Owned For
Owner Type
Purchase Details
Closed on
Jan 21, 2022
Sold by
Coffey Karolina
Bought by
Orrick Russell Scott
Current Estimated Value
Purchase Details
Closed on
Jan 5, 2006
Sold by
Coffey Christopher J
Bought by
Coffey Christopher J and Coffey Karolina
Home Financials for this Owner
Home Financials are based on the most recent Mortgage that was taken out on this home.
Original Mortgage
$207,500
Interest Rate
6.04%
Mortgage Type
New Conventional
Purchase Details
Closed on
Dec 29, 2000
Sold by
Newman James V
Bought by
Metro Homes & Management Llc
Purchase Details
Closed on
Nov 21, 1997
Sold by
Stark John C and Stark Marguerite
Bought by
Coffey Christopher J
Home Financials for this Owner
Home Financials are based on the most recent Mortgage that was taken out on this home.
Original Mortgage
$123,750
Interest Rate
9%
Mortgage Type
New Conventional
Create a Home Valuation Report for This Property
The Home Valuation Report is an in-depth analysis detailing your home's value as well as a comparison with similar homes in the area
Home Values in the Area
Average Home Value in this Area
Purchase History
| Date | Buyer | Sale Price | Title Company |
|---|---|---|---|
| Orrick Russell Scott | $480,000 | -- | |
| Coffey Christopher J | -- | -- | |
| Metro Homes & Management Llc | -- | -- | |
| Coffey Christopher J | $165,000 | -- |
Source: Public Records
Mortgage History
| Date | Status | Borrower | Loan Amount |
|---|---|---|---|
| Previous Owner | Coffey Christopher J | $207,500 | |
| Previous Owner | Coffey Christopher J | $123,750 |
Source: Public Records
Tax History Compared to Growth
Tax History
| Year | Tax Paid | Tax Assessment Tax Assessment Total Assessment is a certain percentage of the fair market value that is determined by local assessors to be the total taxable value of land and additions on the property. | Land | Improvement |
|---|---|---|---|---|
| 2025 | $4,757 | $254,760 | $73,680 | $181,080 |
| 2023 | $5,419 | $192,000 | $46,200 | $145,800 |
| 2022 | $3,414 | $168,760 | $43,480 | $125,280 |
| 2021 | $3,381 | $146,440 | $35,600 | $110,840 |
| 2020 | $3,372 | $122,000 | $42,320 | $79,680 |
| 2019 | $393 | $122,000 | $42,320 | $79,680 |
| 2018 | $3,110 | $143,440 | $52,920 | $90,520 |
| 2017 | $3,254 | $107,760 | $23,320 | $84,440 |
| 2016 | $3,199 | $107,760 | $23,320 | $84,440 |
| 2015 | $3,233 | $107,760 | $23,320 | $84,440 |
| 2014 | $3,341 | $107,760 | $23,320 | $84,440 |
Source: Public Records
Map
Nearby Homes
- 134 Wards Crossing Way Unit 17
- 11085 State Bridge Rd
- 11390 Ridge Hill Dr
- 4740 Carversham Way
- 11125 Pinehigh Dr
- 4790 Roswell Mill Dr
- 4645 Valais Ct Unit 109
- 517 Boardwalk Way
- 515 Boardwalk Way
- 4015 Breckenridge Ct
- 4305 Pine Vista Blvd
- 130 Douglas Fir Ct Unit 1
- 4845 Weathervane Dr
- 635 Park Creek Trace
- 690 Kimball Parc Way
- 3965 Brookline Dr
- 680 Kimball Parc Way
- 4905 Weathervane Dr
- 4815 Tanners Spring Dr
- 2060 Park Glenn Dr
- 220 Brookhollow Trace
- 230 Brookhollow Trace
- 11285 Amy Frances Ln
- 210 Brookhollow Trace
- 240 Brookhollow Trace
- 200 Brookhollow Trace
- 11280 Amy Frances Ln
- 235 Brookhollow Trace
- 215 Brookhollow Trace
- 11270 Amy Frances Ln
- 11275 Amy Frances Ln
- 190 Brookhollow Trace Unit 1
- 525 Willowbrook Run
- 225 Brookhollow Trace
- 205 Brookhollow Trace
- 11260 Amy Frances Ln Unit 11260
- 11260 Amy Frances Ln
- 11260 Amy Frances Ln
- 11260 Amy Frances Ln Unit 1
- 515 Willowbrook Run Unit 2