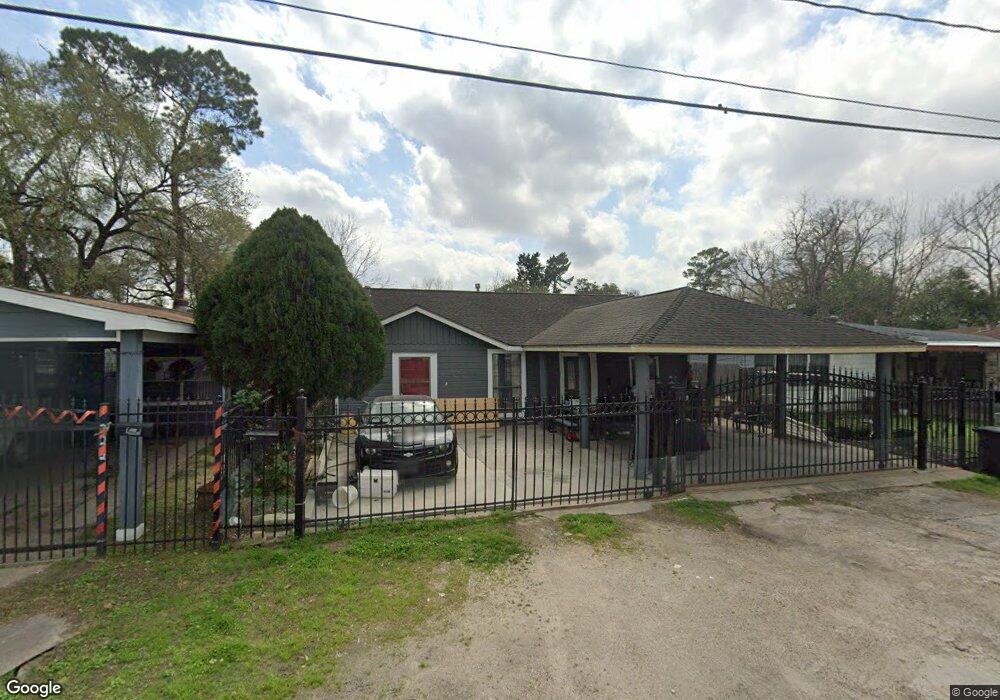
220 Burress St Houston, TX 77022
Northside-Northline NeighborhoodEstimated Value: $179,923 - $253,000
3
Beds
2
Baths
1,281
Sq Ft
$178/Sq Ft
Est. Value
About This Home
This home is located at 220 Burress St, Houston, TX 77022 and is currently estimated at $227,981, approximately $177 per square foot. 220 Burress St is a home located in Harris County with nearby schools including Burbank Elementary School, Burbank Middle School, and Sam Houston Math, Science & Technology Center.
Ownership History
Date
Name
Owned For
Owner Type
Purchase Details
Closed on
Dec 27, 1993
Sold by
Nitsch Frances D and Nitsch Frances D
Bought by
Moreno Blas and Moreno Antonia
Current Estimated Value
Home Financials for this Owner
Home Financials are based on the most recent Mortgage that was taken out on this home.
Original Mortgage
$25,554
Interest Rate
7.12%
Create a Home Valuation Report for This Property
The Home Valuation Report is an in-depth analysis detailing your home's value as well as a comparison with similar homes in the area
Home Values in the Area
Average Home Value in this Area
Purchase History
| Date | Buyer | Sale Price | Title Company |
|---|---|---|---|
| Moreno Blas | -- | -- |
Source: Public Records
Mortgage History
| Date | Status | Borrower | Loan Amount |
|---|---|---|---|
| Closed | Moreno Blas | $25,554 |
Source: Public Records
Tax History Compared to Growth
Tax History
| Year | Tax Paid | Tax Assessment Tax Assessment Total Assessment is a certain percentage of the fair market value that is determined by local assessors to be the total taxable value of land and additions on the property. | Land | Improvement |
|---|---|---|---|---|
| 2025 | $1,106 | $156,620 | $76,000 | $80,620 |
| 2024 | $1,106 | $148,883 | $69,750 | $79,133 |
| 2023 | $1,106 | $167,138 | $42,500 | $124,638 |
| 2022 | $2,050 | $139,445 | $42,500 | $96,945 |
| 2021 | $1,972 | $112,676 | $42,500 | $70,176 |
| 2020 | $1,863 | $104,836 | $42,500 | $62,336 |
| 2019 | $1,770 | $101,119 | $35,000 | $66,119 |
| 2018 | $992 | $81,716 | $29,250 | $52,466 |
| 2017 | $1,461 | $81,716 | $29,250 | $52,466 |
| 2016 | $1,329 | $68,297 | $27,500 | $40,797 |
| 2015 | $808 | $47,769 | $20,000 | $27,769 |
| 2014 | $808 | $47,769 | $20,000 | $27,769 |
Source: Public Records
Map
Nearby Homes
- 216 Burress St
- 249 De Boll St
- 253 De Boll St
- 108 Fichter St
- 318 Charlock St
- 132 Grothe Ln
- 90 Burress St Unit B
- 90 Burress St Unit A
- 70 Burress St
- 202 Burbank St
- 9026 Mcgallion Rd
- 61 Trenwood Ln
- 411 Berry Rd
- 56 Wellford St
- 44 Farrell St
- 45 Wellford St
- 219 Heaney Dr
- 9625 Fulton St
- 702 Pennington St
- 88 Berry Rd